To improve the usability and the content of a website or application, it is important to understand how the site or application behaves when a user uses it to perform a task. Commvault Web Analytics lets you track the key performance indicators of your website or web application, such as web traffic, content search, accessibility, speed, and so on. Web Analytics also provides statistical information about the users of your website or application by converting the interactions of the users with your website or application into actionable insights.
Key Features
Commvault Web Analytics offers the following key features:
Simplified Interface for Registration
Web Analytics offers a single, easy-to-use interface where you can specify comprehensive information about the websites that you want to track. The options available on the Registration page also display examples to help you provide accurate information required for registration. You can retrieve the snippet that Web Analytics generates after registration of a website and add it to the source code of the website at any time.
Cross Segmentation of Reports
Web Analytics collects basic information such as the type and number of users visiting the website, the browser and the browser languages used to visit the website, the devices used to visit the website, and so on. Web Analytics also collects advanced information, such as user clicks, site search, site content, referrer used to access the website, and so on. You can cross segment the basic statistical information with the advanced reports to infer the behavior of the website relative to the user type, browser used, languages used, devices used, and geographical distribution. For example, you can cross segment the data you received for your website speed with the basic statistics to determine the speed of your website across different regions or with different browsers.
Predefined and Custom Date Range for Reports
Web Analytics provides options to view statistics of your website or application across different time intervals. You can select any prior or current time range from the list of predefined periods or provide a custom date range to view and compare reports. The data is automatically recalculated and presented to you based on the range you select.
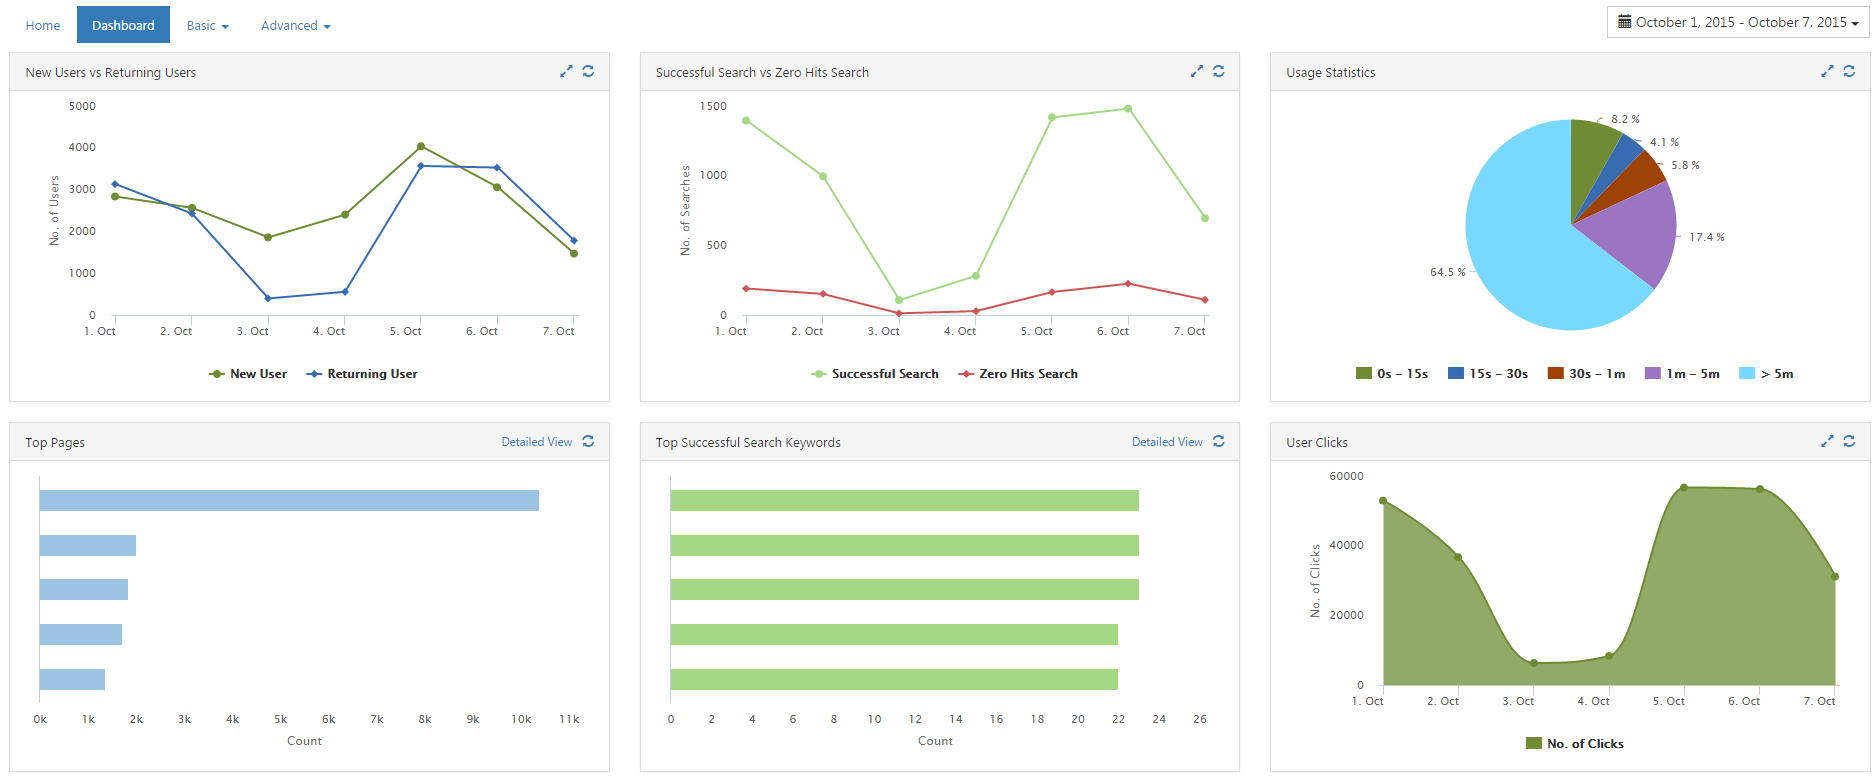
Dashboard View
The Web Analytics Dashboard displays a collection of widgets so that you can quickly visualize the data received for a website. The Dashboard displays a preview of the most critical information gathered for the website, such as new users versus returning users, successful search versus zero hit search, usage statistics, user clicks, and so on.
Report Sharing
Web Analytics provides options to share the report of a website to other users of Web Console. The reports of a registered website can be viewed by multiple Web Console users, thereby eliminating the need to register a website by each user. Users can view the reports of a website and take necessary actions to optimize its success.
Report Scheduling
A Web Console user with Report Management privileges can schedule the analytics reports to distribute them at regular intervals, such as daily, weekly, or monthly, without the user logging on to the Web Console. You can send the reports to multiple recipients, can save them to a network location as a backup, or both. You can create multiple schedules with different groups of recipients and enable them at a time.