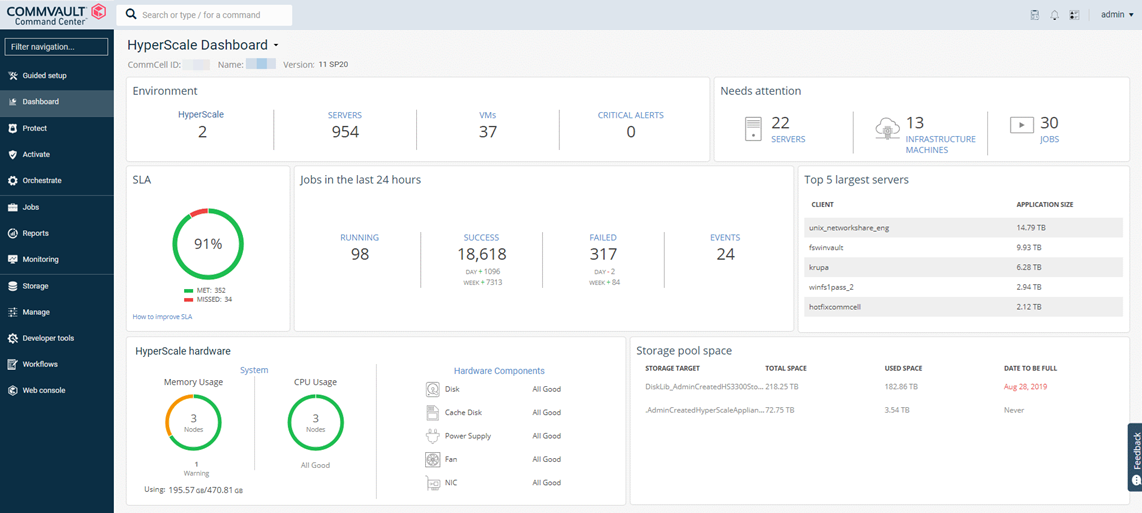
The HyperScale dashboard in the Command Center provides the current status of the HyperScale X Appliance nodes, including hardware errors, and can be used to to quickly evaluate the health of the nodes.
The HyperScale dashboard can be accessed using one of the following methods:
-
By clicking the HyperScale link, displayed in the Environment section of the Overview Dashboard.
-
By selecting the HyperScale Dashboard option from the Overview Dashboard, list displayed at the top of the page.
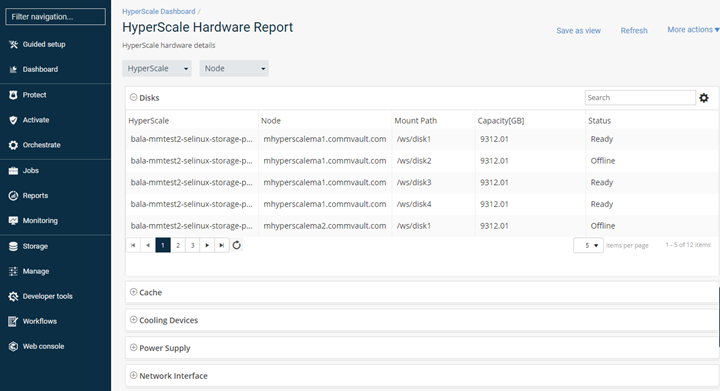
Detailed View
A detailed HyperScale Hardware Report can be viewed by clicking the Hardware Components from the Dashboard. Each hardware component (Disks, Cooling Devices, Power Supply, and Network Interface) provides a detailed view as sub-sections in this report. You can also filter the report information based on the storage pool and the node associated with the selected storage pool.
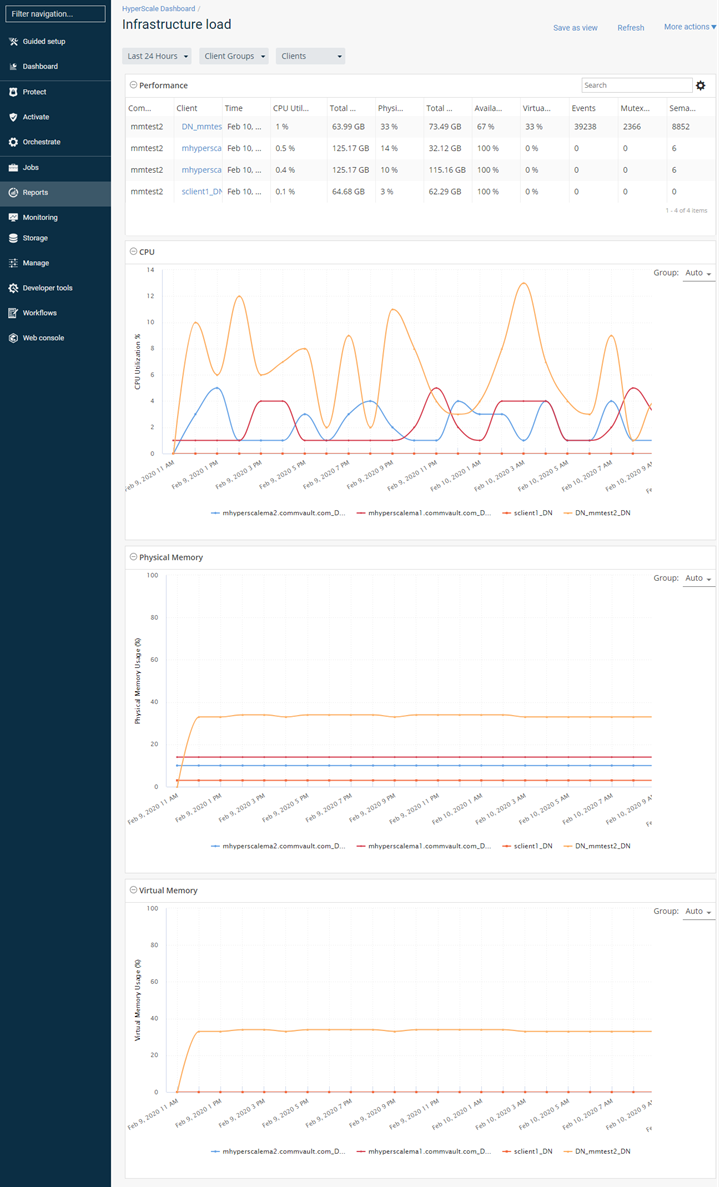
Infrastructure View
The Infrastructure Load view can be viewed by clicking System from the Dashboard. Performance-related information for each node is displayed in this view. In addition, the CPU performance, the amount of physical memory that was used, and the amount of virtual memory that was used also appears in charts.