The Command Center provides the current status of the HyperScale Flex storage, including hardware errors, and can be used to quickly evaluate the health of the storage.
Note
The Storage immutability and Password-based root access status may take some time to reflect correctly in the Command Center after installation, configuration, or after adding new HyperScale Flex node(s).
If alerts are generated for these items shortly after installation or configuration, you can safely ignore them.
Viewing the List of HyperScale Flex Storage
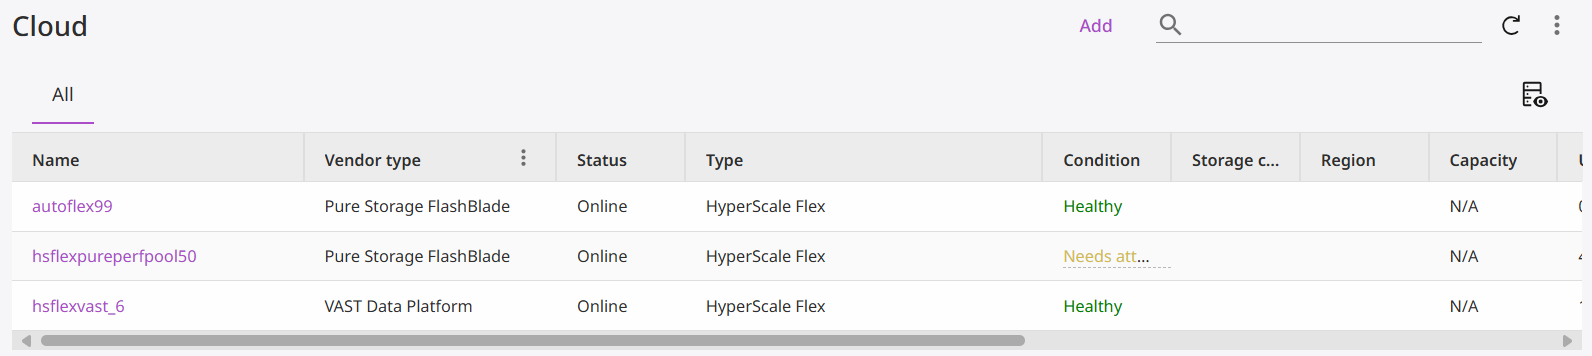
To view the list of HyperScale Flex storages, from the navigation pane, go to Storage > Cloud. This view allows you to monitor and manage HyperScale Flex storages in the Commvault environment. It provides a consolidated view of capacity utilization, health status, and availability of storage resources, helping identify issues early and maintain optimal performance.
Viewing Information of a HyperScale Flex Storage
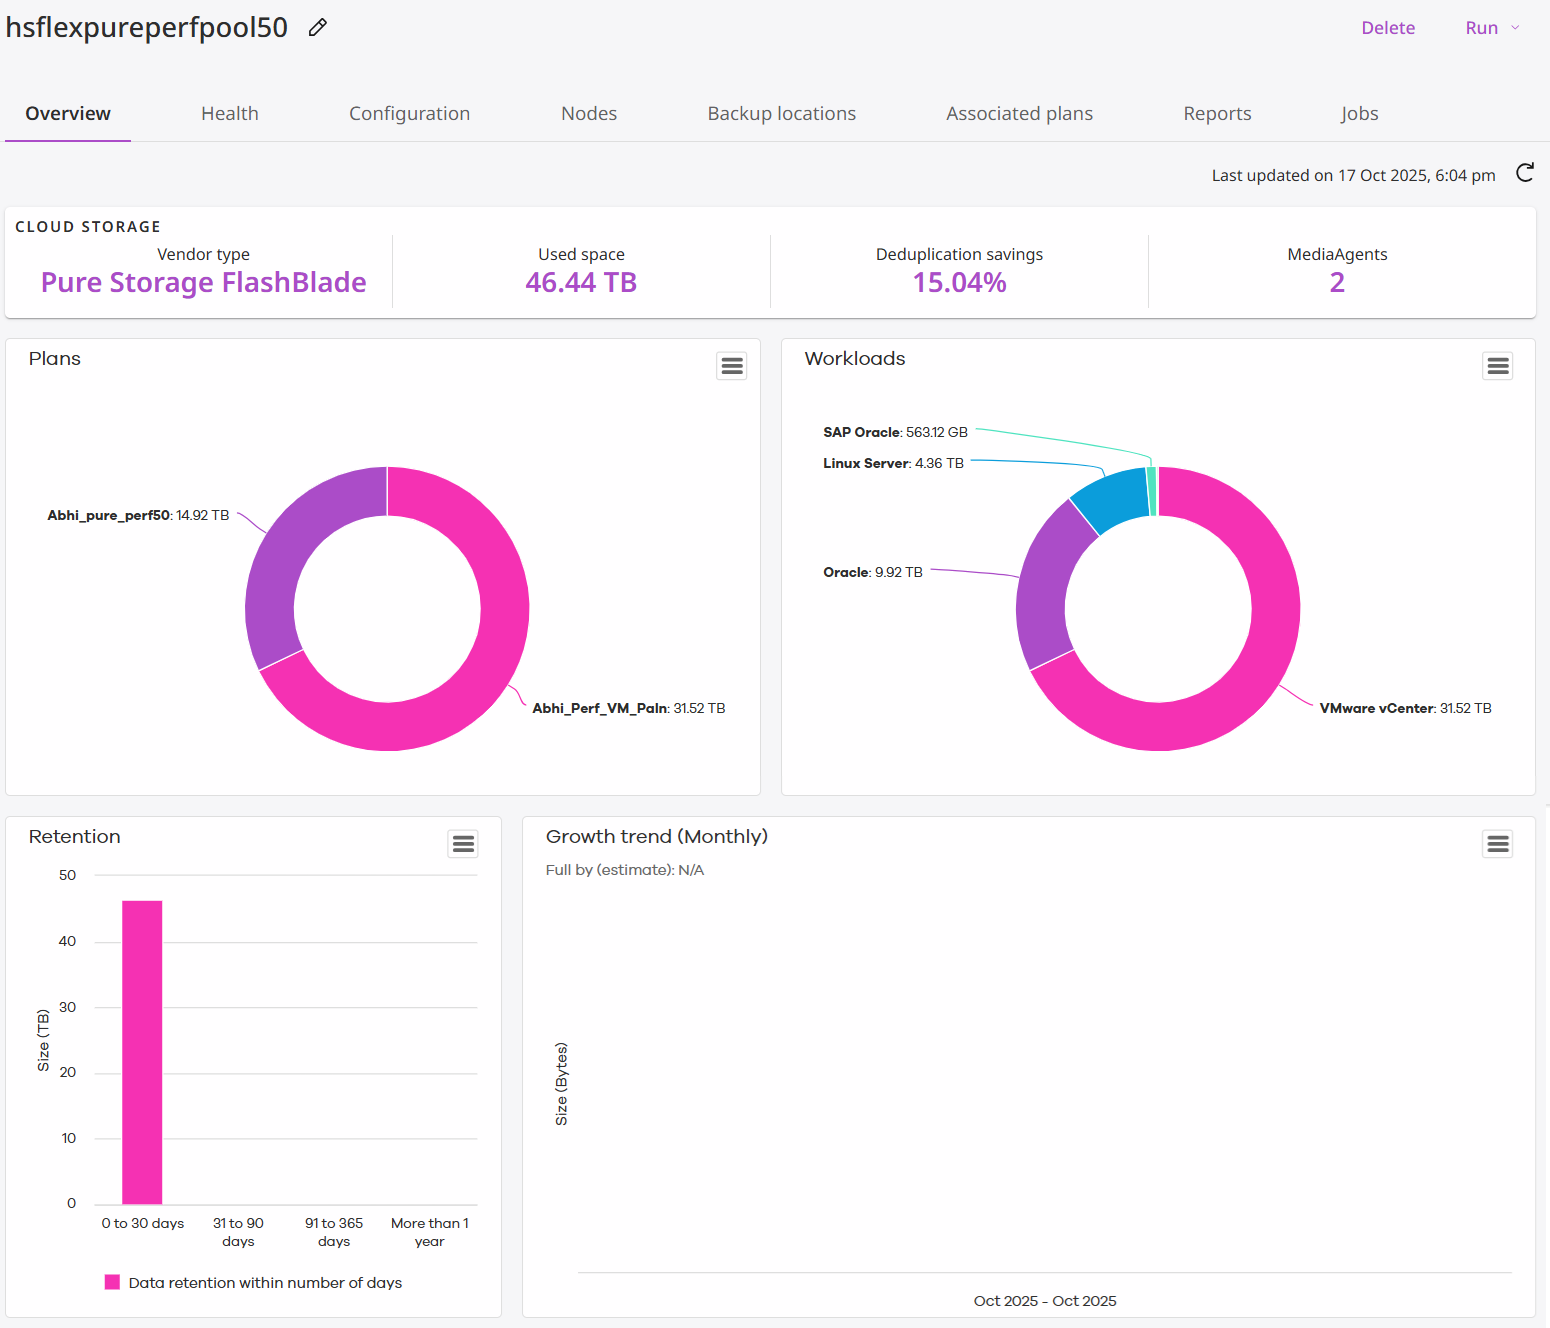
To view the information of a HyperScale Flex storage, from the navigation pane, go to Storage > Cloud, and then click the storage. The Overview page appears.
The general overview and purpose of the different views is given below:
-
Cloud Storage Displays high-level information about the storage infrastructure being used — such as the vendor type, total capacity, used space, deduplication savings, and number of MediaAgents. It provides a quick snapshot of storage consumption and efficiency across the storage.
-
Plans Shows how the total storage space is distributed among different backup or data protection plans. It helps you understand which plans consume the most space and manage capacity planning or policy optimization accordingly.
-
Workloads Visualizes the data usage by different workload types (e.g., VMware, Oracle, SAP, Linux servers, etc.). It helps you to analyze which workload categories or environments are contributing most to storage usage, supporting workload balancing and capacity forecasting.
-
Retention Illustrates the age distribution of stored data, categorized by retention periods (e.g., 0–30 days, 31–90 days, etc.). It helps you to monitor how long data is retained before expiration or deletion, ensuring compliance with retention policies and optimizing space utilization.
-
Growth Trend (Monthly) Shows the historical or projected growth in storage usage over time. It enables you to track data growth trends, identify capacity risks, and support long-term storage planning.
These views help you monitor, manage, and optimize storage pool performance and utilization.
Viewing the Health Information of a Storage
To view the health information of a HyperScale Flex storage, complete the following steps:
-
From the navigation pane, go to Storage > Cloud.
The Cloud page appears.
-
Click the storage.
The Overview page appears.
-
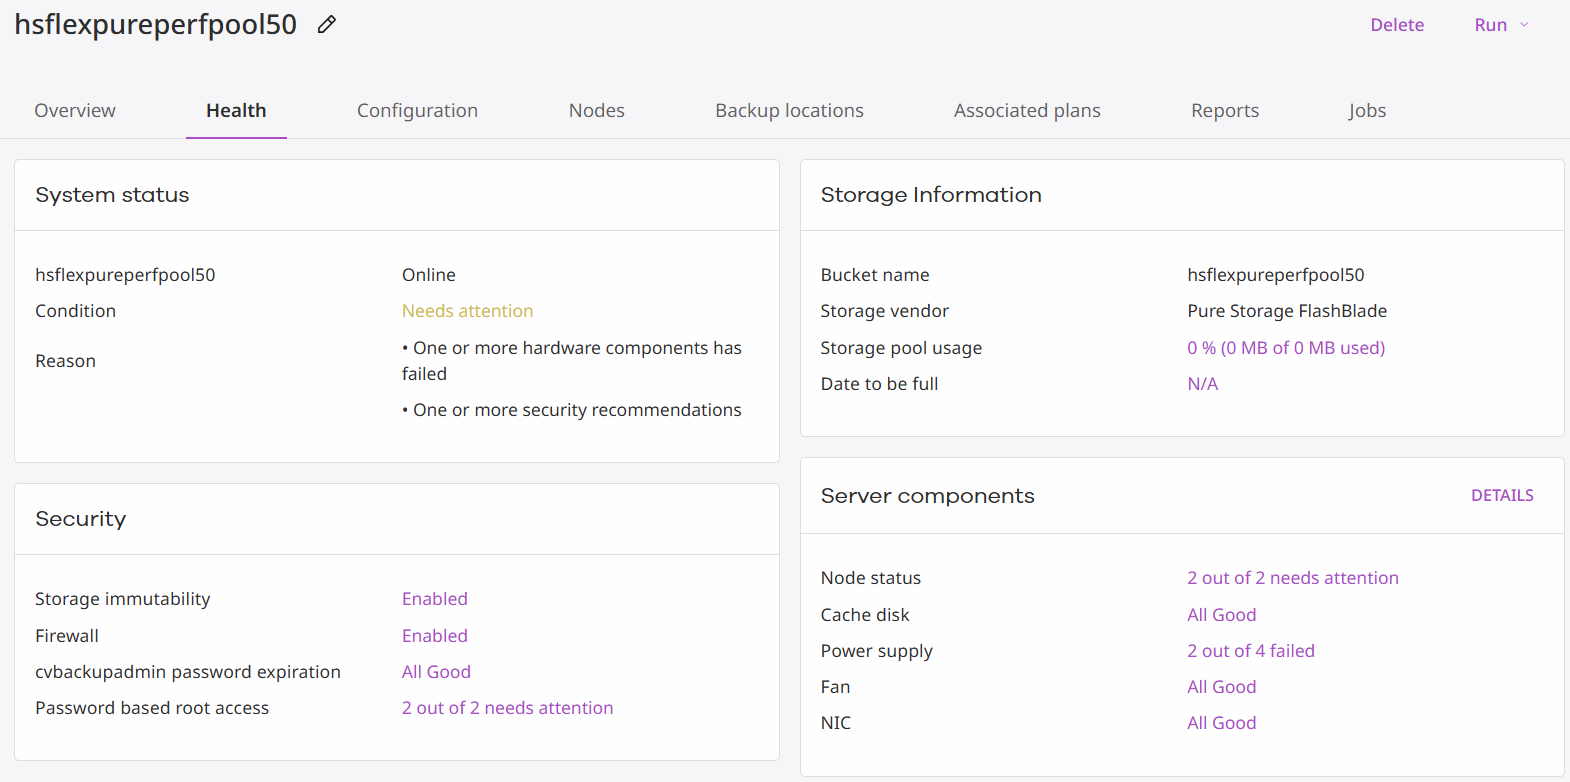
Click the Health tab.
The Health page appears.
Viewing the Health Report of a Storage
To view the health report of a HyperScale Flex storage, complete the following steps:
-
From the navigation pane, go to Storage > Cloud.
The Cloud page appears.
-
Click the storage.
The Overview page appears.
-
Click the Health tab.
The Health page appears.
-
In the Server components area, click Details or the status of a component.
The Hyperscale Flex Health Report page appears.
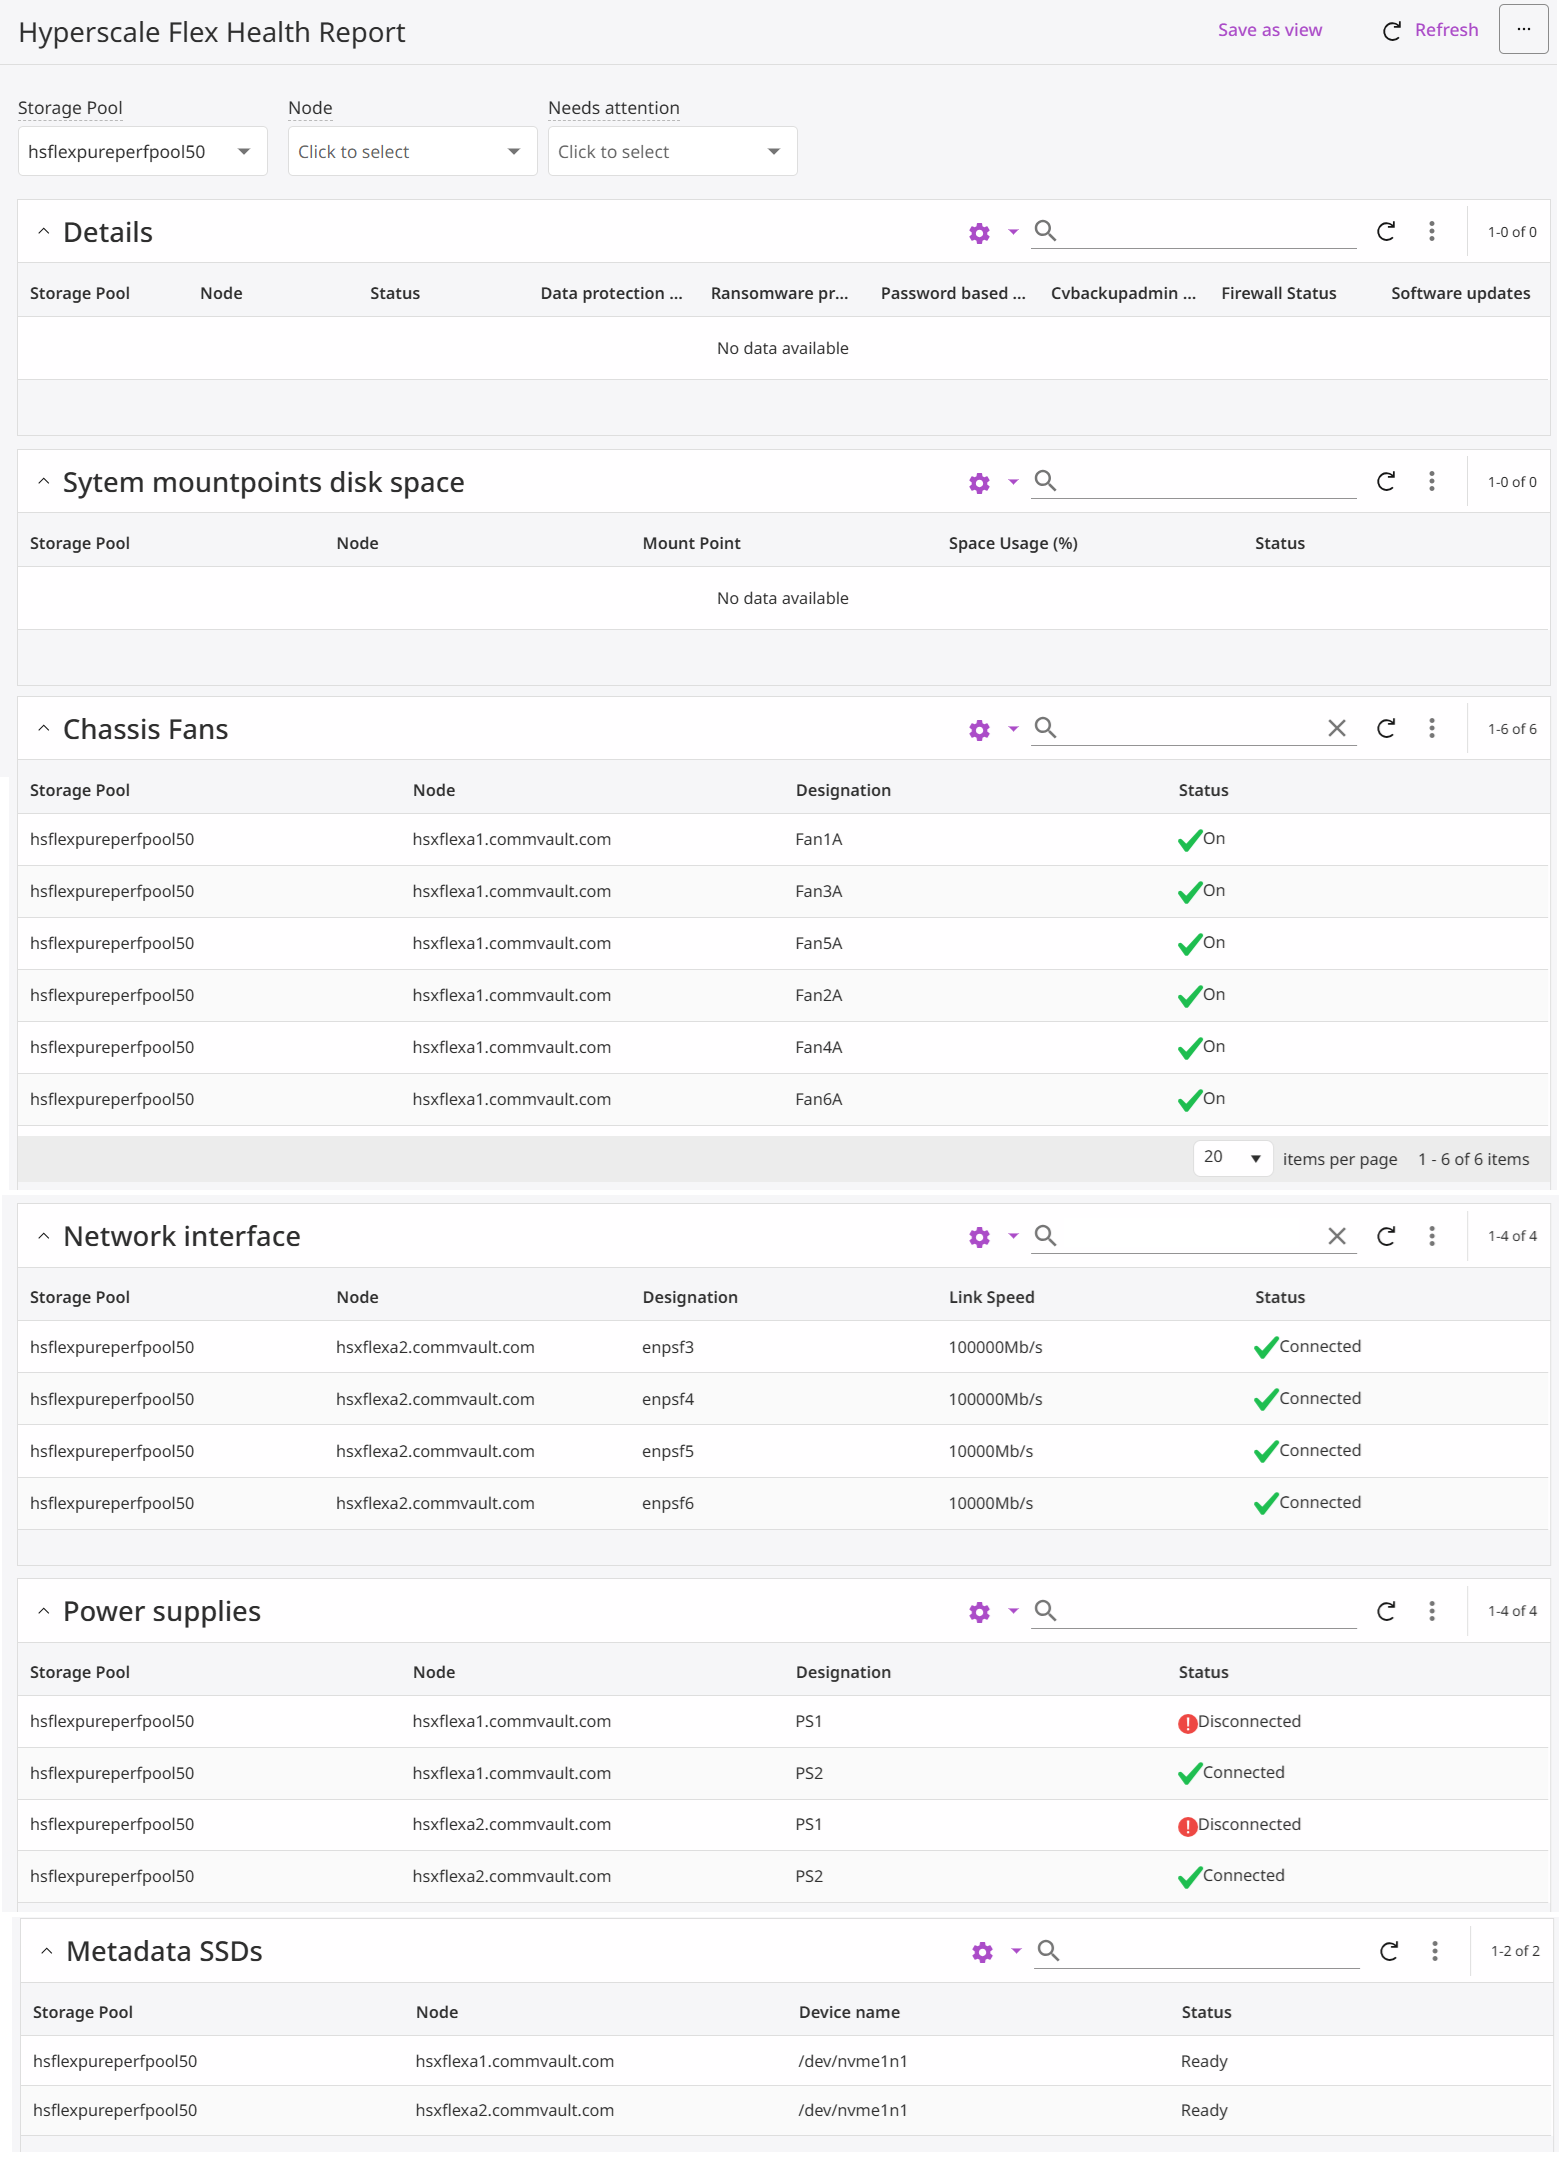
The Hyperscale Flex Health Report provides a consolidated status view of the physical and logical components in a Hyperscale Flex storage environment. It enables administrators to monitor the health, connectivity, and operational status of system hardware and network elements.
-
Details
Description: Displays system-level information such as data protection status, ransomware protection, firewall status, and software updates.
Purpose: Offers a quick summary of key configuration and security aspects for each node in the storage pool.
-
System Mountpoints Disk Space
Description: Shows storage mount points, available space, and usage percentages for each node.
Purpose: Helps track disk utilization and identify potential capacity or performance issues.
-
Chassis Fans
Description: Lists the status of all physical fans installed in the chassis for each node.
Purpose: Ensures proper cooling and hardware health by verifying that all fans are operational.
-
Network Interface
Description: Displays details of network interfaces, link speeds, and connection status for each node.
Purpose: Monitors network connectivity and throughput to ensure reliable data transfer and communication between components.
-
Power Supplies
Description: Provides information about the power supply units (PSUs) of each node and their connection status.
Purpose: Ensures redundancy and stability by monitoring whether all power units are connected and functioning.
-
Metadata SSDs
Description: Lists the SSD devices used for storing system metadata along with their operational status.
Purpose: Confirms that the metadata disks are healthy and ready, as they are essential for maintaining high system performance and reliability.
Summary
Overall, this report gives administrators a comprehensive snapshot of system health, covering:
-
Hardware status (fans, power supplies, SSDs)
-
Network connectivity
-
Disk space and configuration health
The goal is to provide early detection of faults, ensure system reliability, and maintain optimal performance across the Hyperscale Flex infrastructure.