Managed Service Providers can access the Cost Overview Dashboard from the Global Command Center. The Cost Overview Dashboard provides detailed cost and usage information categorized by offerings and by managed accounts.
Procedure
-
From the Global Command Center, click Dashboard.
The Company dashboard appears on the Company tab.
-
Click the Cost overview tab.
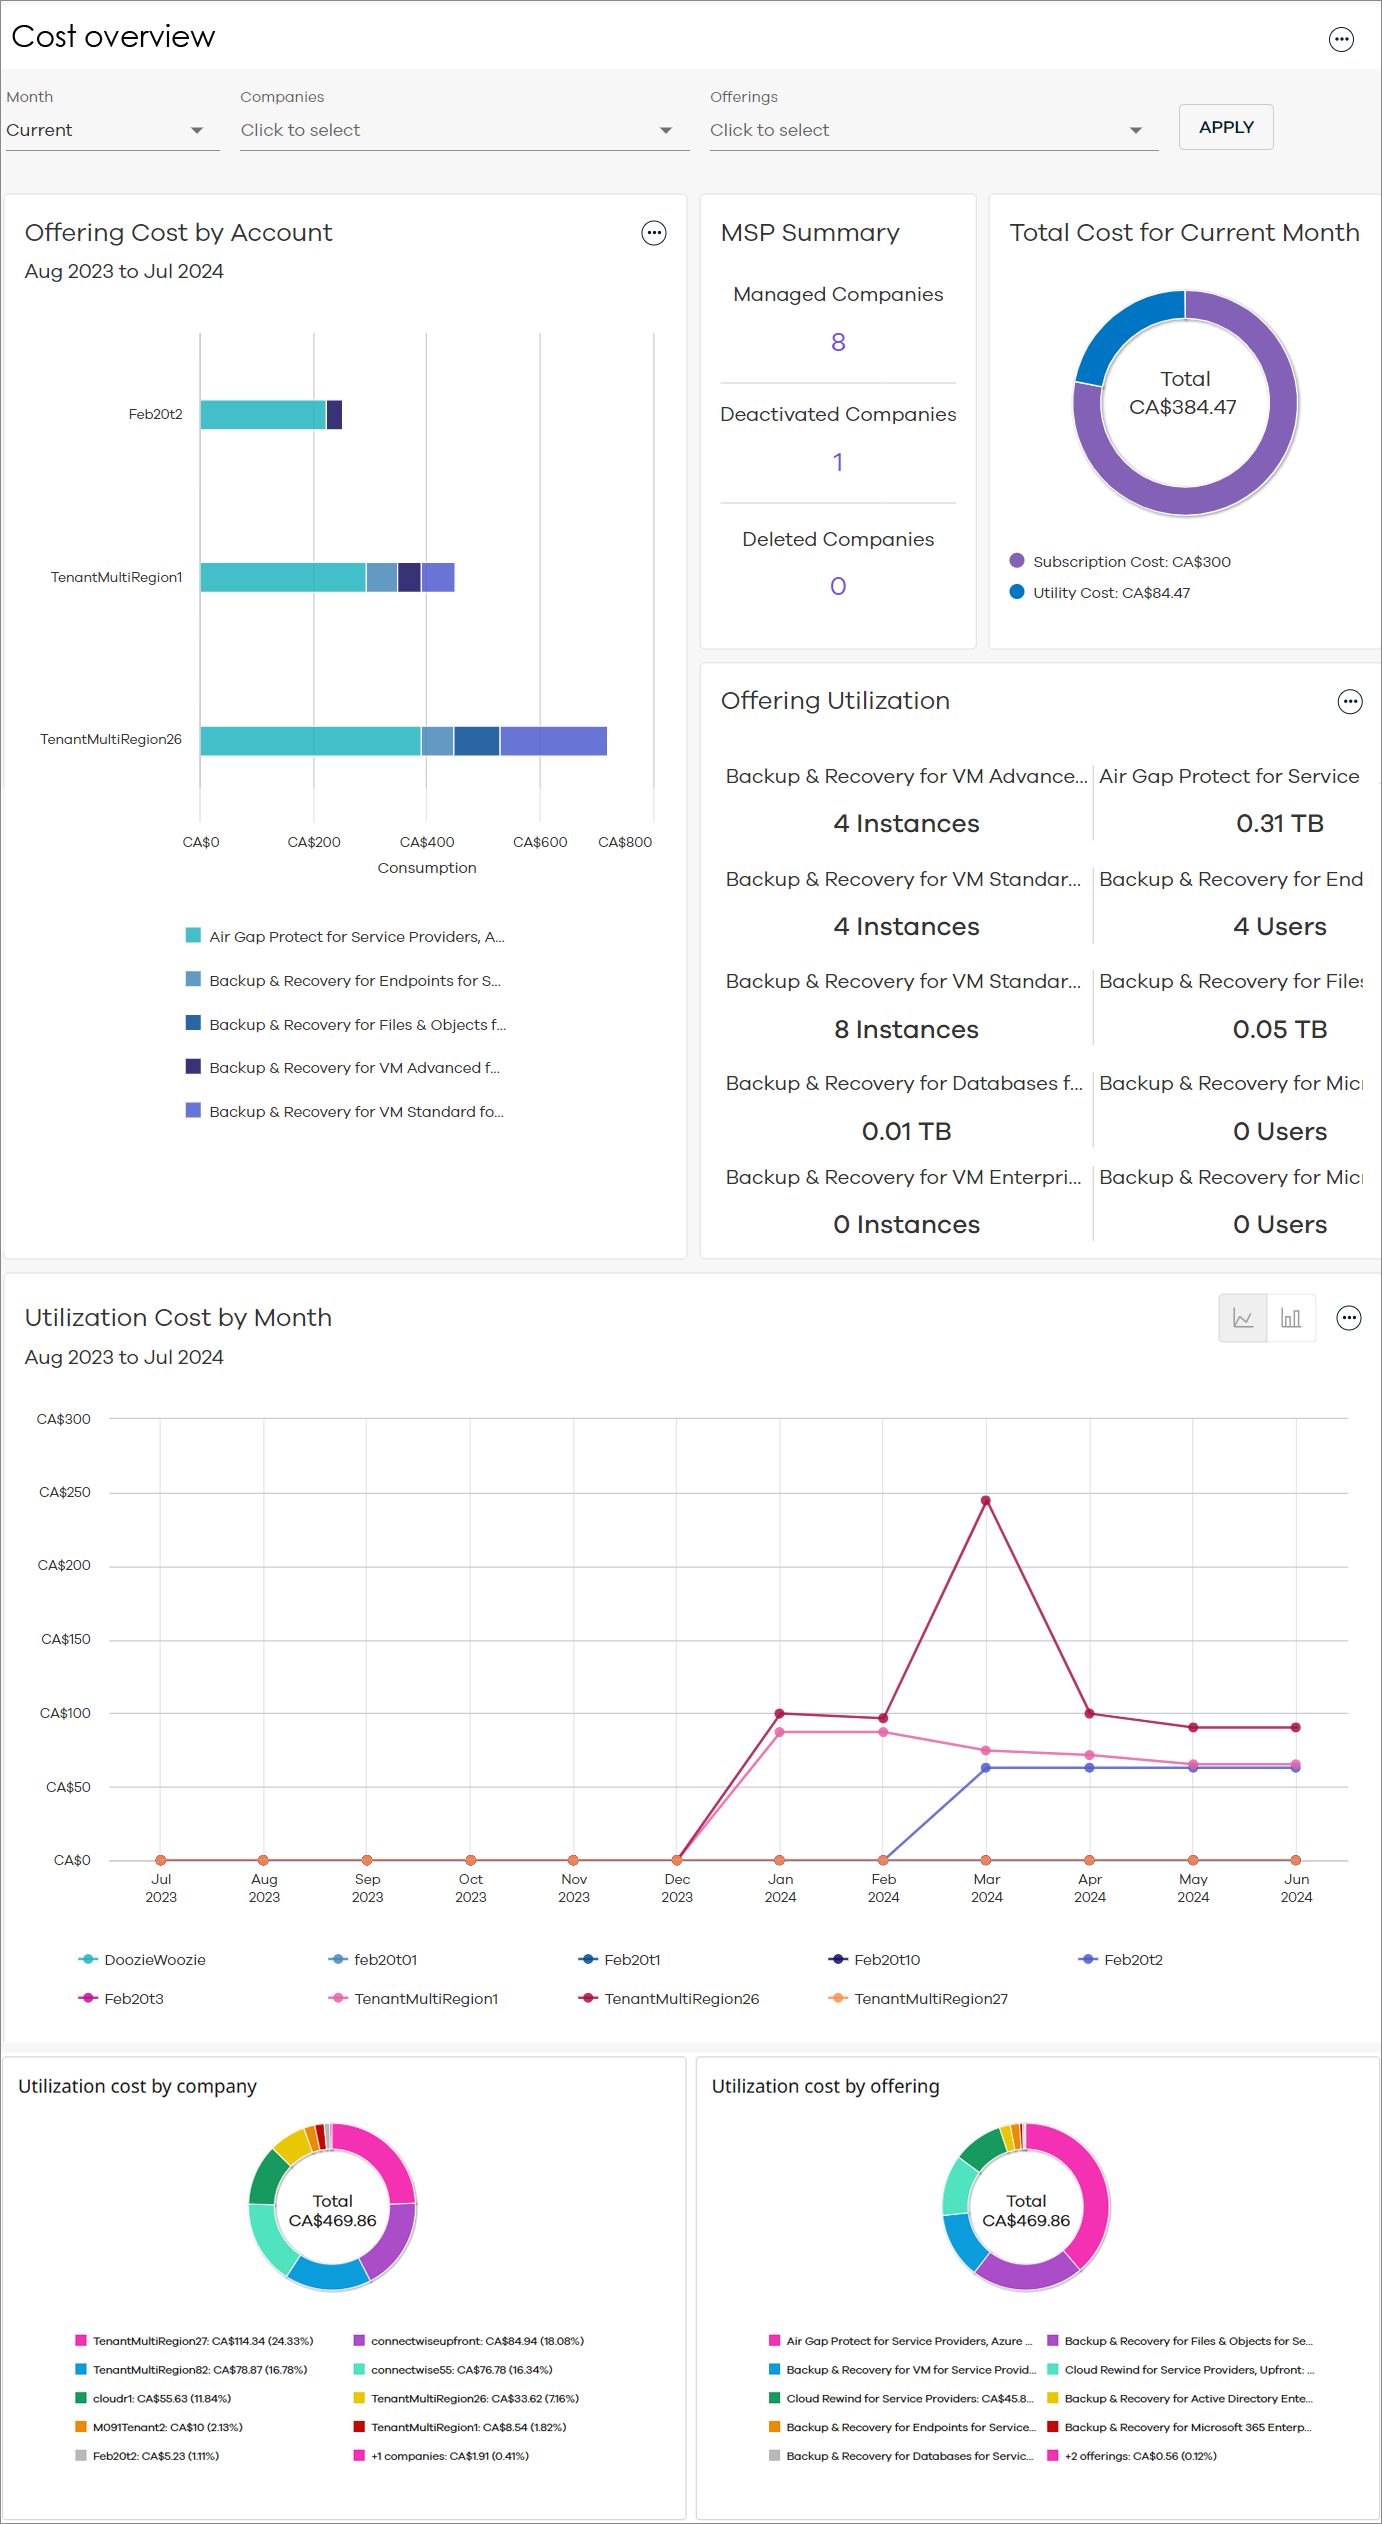
The Cost Overview Dashboard appears, as follows:
-
To refresh the dashboard according to specific datasets, do the following:
-
At the top of the dashboard, select from one of the following filters:
-
Month: Select a month.
-
Companies: Select one or more of your tenants.
-
Offerings: Select one or more offerings used by your tenants.
-
-
Click APPLY.
The dashboard refreshes based on your selections.
-
Dashboard Description
The following table includes descriptions for all the tiles on the Cost Overview Dashboard.
|
Tile |
Description |
|---|---|
|
Offering Cost by Account |
The costs per offering for your top 10 accounts, for the last 12 months leading up to the month that you selected in the Month filter. Mouse-over each segment of the bar chart to view costs per offering for each account. Click the action button - View in full screen: View the chart in full screen mode. - Display totals: Show cost totals in the chart. - Save as: Save chart as a PDF, or convert the chart data to an Excel spreadsheet (.xlsx). - Equivalent API: Copy the JSON payload. |
|
MSP Summary |
Number of actively managed companies, deactivated companies, and deleted companies. Click the numbers to view the companies that fall within each of these statuses. |
|
Total Cost for Month |
Your subscription cost and utility cost. |
|
Offering Utilization |
Utilization totals per service. Click the action button - Save as Excel: Convert the tile data to an Excel spreadsheet (.xlsx). |
|
Utilization Cost by Month |
Utilization costs for your accounts, for the last 12 months leading up to the month that you selected in the Month filter. Use the button Click the action button - View in full screen: View the chart in full screen mode. - Display totals: Show cost totals in the chart. - Save as: Save chart as a PDF, or convert the chart data to an Excel spreadsheet (.xlsx). - Equivalent API: Copy the JSON payload. |
|
Utilization Cost by Company |
Utilization costs showing cost distribution across the top 9 accounts, plus a summary for all other accounts. |
|
Utilization Cost by Offering |
Utilization costs showing cost distribution across the top 9 service offerings, plus a summary for all other offerings. |
 to select from the following options: