You can configure custom groups to display in bar charts, donut charts, and pie charts.
Before You Begin
-
To build and deploy reports, your CommCell user account requires a role with the Add Report permission and an association with the CommCell entity.
For more information on users, permissions, and associations, see User Administration and Security - Overview.
Procedure
-
On the Web Console for the Private Metrics Reporting Server, click Reports.
The Worldwide Dashboard appears.
-
To open a report where you have already added a data set, from the navigation pane, click Configuration > Reports, and next to the Report Name under Actions, click Edit.
-
Optional: If your report has multiple pages, click the tab for the page that you want to edit.
-
Configure any of the following chart types:
-
Select the chart, and on the Properties tab, click Fields

A name appears for each field in the chart.
-
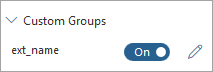
To create custom bars, donut pieces, or pie pieces based on string data from the field, configure the chart settings under Custom Groups:
-
Set the Field Name to On, and then click Edit
 .
.
-
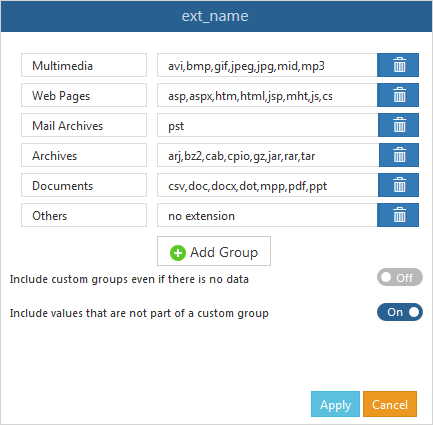
Click Add Group.
-
In the Group Name box, type a name for the bar or piece.
For example: Multimedia
-
In the Group Values box, type text or a formula that will define the content of the bar or piece.
For example: avi,bmp,gif,jpeg,jpg,mid,mp3,mp4,mpeg,mpg,png,qt,wav,wmv,mov
You can use regular expressions to define the content
-
Click Add Group to define each additional bar that will appear in the chart.
-
To remove a bar or piece, click Delete Group
 .
. -
To include all of your custom groups, even if there is no data to display, set Include custom groups even if there is no data to On.
-
To include all values that are not part of a custom group in a single group titled, "Others," set Include values that are not part of a custom group to On.
-
Click Apply.
-
-
To create custom bars, donut pieces, or pie pieces based on numerical data in the field, configure the chart settings under Custom Groups:
-
Set the Field Name to On, and then click Edit
.
-
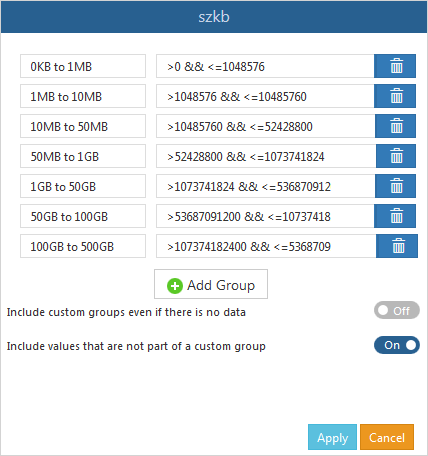
Click Add Group.
-
In the Group Name box, type a name for the bar or piece.
For example: 0KB to 1MB
-
In the Group Values box, type a formula that will define the content of the bar or piece.
For example: >0 && <=1048576
You can use regular expressions to define the content
-
Click Add Group to define each additional bar that will appear in the chart.
-
To remove a bar or piece, click Delete Group
. -
To include all of your custom groups, even if there is no data to display, set Include custom groups even if there is no data to On.
-
To include all values that are not part of a custom group in a single group titled, "Others," set Include values that are not part of a custom group to On.
-
Click Apply.
-
-
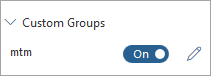
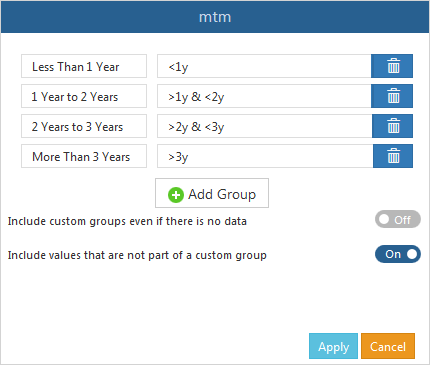
To create custom bars, donut pieces, or pie pieces based on the date and time data in a field, configure the chart settings under Custom Groups:
-
Set the Field Name to On, and then click Edit
.
-
Click Add Group.
-
In the Group Name box, type a name for the bar or piece.
For example: 1 Year to 2 Years
-
In the Group Values box, type a formula that will define the content of the bar or piece.
For example: >1y & <2y
You can use regular expressions to define the content
-
Click Add Group to define each additional bar that will appear in the chart.
-
To remove a bar or piece, click Delete Group
. -
To include all of your custom groups, even if there is no data to display, set Include custom groups even if there is no data to On.
-
To include all values that are not part of a custom group in a single group titled, "Others," set Include values that are not part of a custom group to On.
-
Click Apply.
-
-
To save this version of your report specification in the Reports Manager, at the top of the Report Builder page, click Save.
-
To make the report available to end users on the Reports page, at the top of the page, click Deploy.