In some reports, you can convert a table to a chart. Charts are visual representations of the data in reports.
Procedure
-
From the navigation pane, click Reports.
The Reports page appears.
-
Click a report.
-
At the top-right of the table, click Settings
 , and then click Charts.
 -
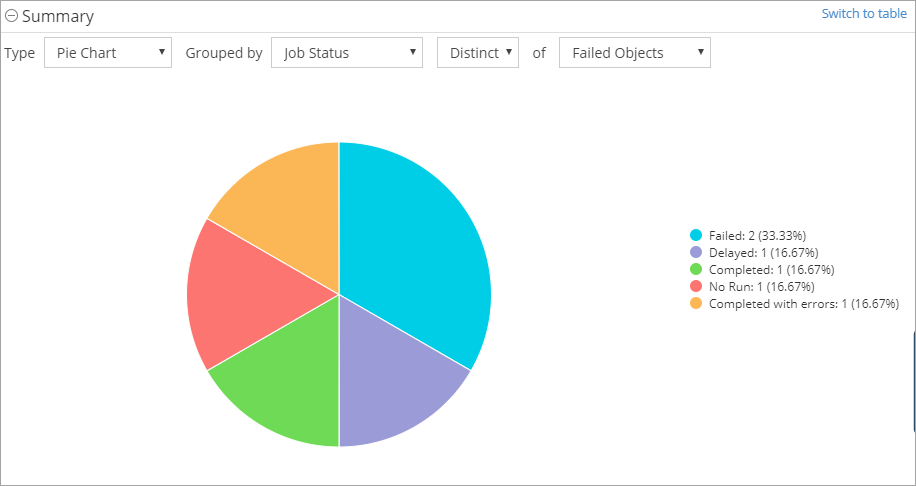
From the Type list, select the type of chart that you want to create.
-
From the Grouped by list, select the data that you want to include in the chart.
Each table column appears in the list.
-
From the list, select the second type of data to include in the chart.
The chart appears.
-
To return to the table view, click Switch to table.