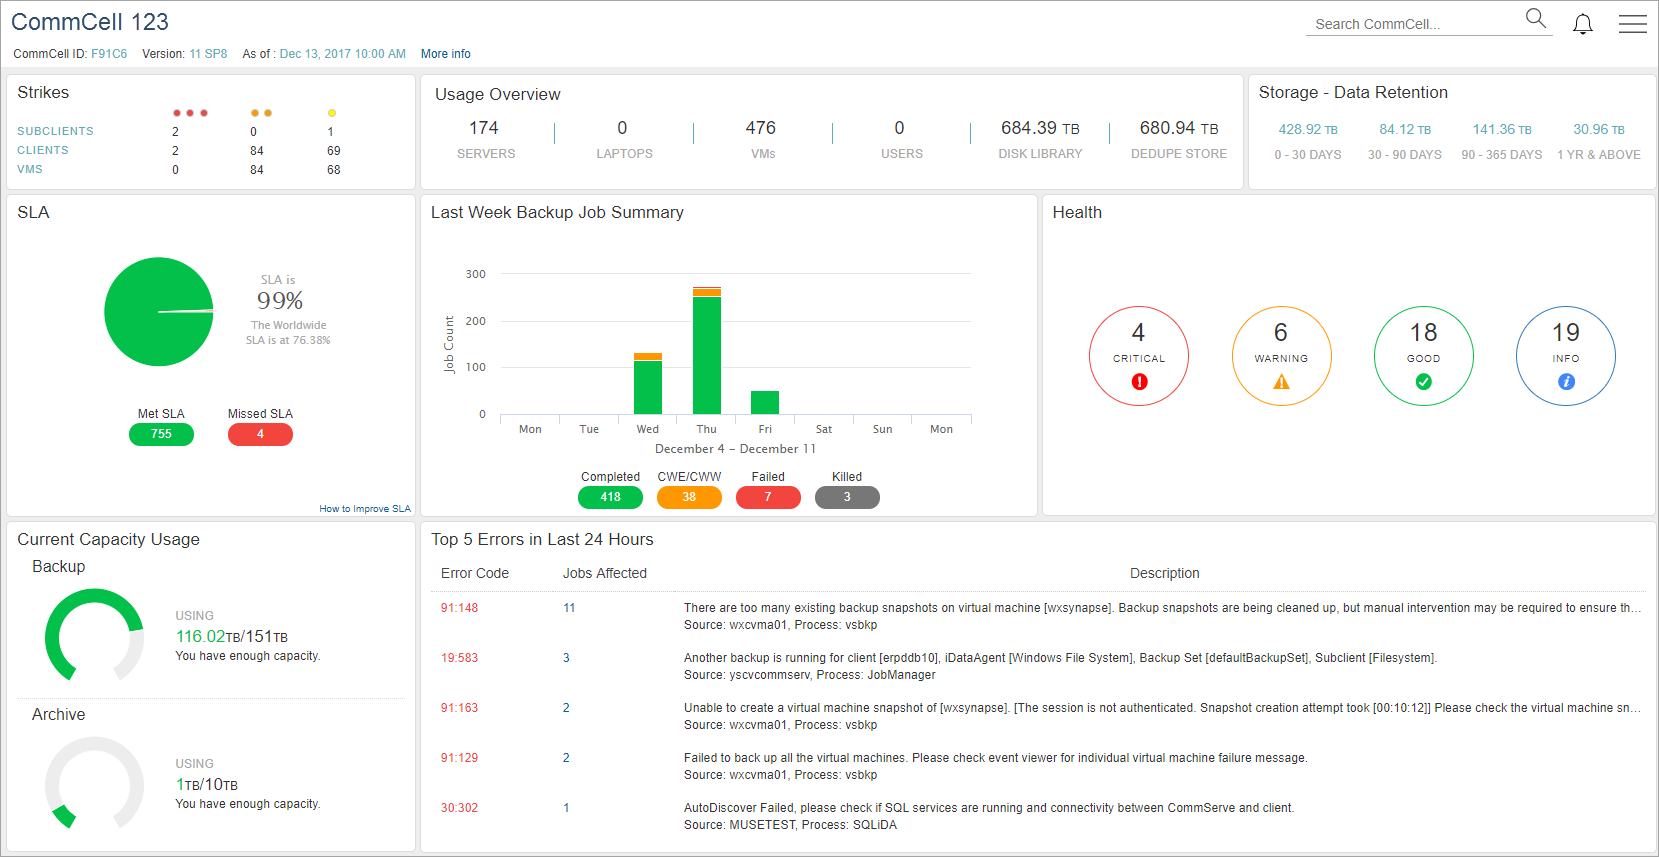
The CommCell Dashboard displays a preview of the most critical information gathered from the CommCell computer. Use the CommCell Dashboard to monitor CommCell performance from a high level on the Web Console.
Many windows on the Dashboard open more detailed reports that you can use to analyze the collected statistics.

The following table includes descriptions for all of the tiles that are visible on the CommCell Dashboard.
|
Tile |
Description |
|---|---|
|
Strikes |
Indicates the number of subclients, clients, and VMs that have one or more failed backup jobs since the last successful backup job. To view the Strike Count Report, click Strikes. |
|
Usage Overview |
The number of servers, laptops, VMs, and users, the amount of space being used in disk libraries, and the size of deduplicated data. |
|
Storage - Data Retention |
The amount of stored data that will be retained for the next 0–30 days, 30–90 days, 90–365 days, and one year and above. To view the Data Retention Report, click Storage - Data Retention. Storage - Data Retention estimates the amount of data that will be eligible for pruning, based solely on the retention days and extended retention settings that are configured in the storage policy copy. Other parameters related to data retention, such as retention cycles and dependencies amongst backup types are not considered in this calculation. |
|
SLA |
Displays the percentage of all client computers that met or missed Service Level Agreement (SLA) at the last time data was collected. The formula used to calculate SLA is: Number of Clients that Met SLA / Total Number of Clients, at the time of data collection, regardless of the SLA time period configured for that particular client. To view the SLA Details Report, click SLA. The following are the options to display the list of server in pending action status: Customer Action Pending: The servers or subclients excluded from SLA by the customer. Service Provider Action Pending: The servers or subclients excluded from SLA by the MSP. Note: The above options are displayed only when the user is having a server in any one of the above pending action category. |
|
Last Week Backup Job Summary |
Displays the number of jobs that completed, completed with errors, failed, or were killed during each day in the last week. To view the Activity Report, click Last Week Backup Job Summary. |
|
Health |
Displays the number of tiles that are in Good, Warning, or Critical state for each category of the Health Report. To view more detailed information about each category in the Health Report, click Health. |
|
Current Capacity Usage |
Indicates the amount of data in all of the largest full backup jobs and all archive jobs on all subclients. Also indicates whether you are approaching the capacity license limit. To view the License Summary Worldwide Report, click Current Capacity Usage. |
|
Top 5 Errors in Last 24 Hours |
Displays the five most common errors in the last day, including the error code, the number of jobs affected by the error, and the description of the error. To view any knowledge base articles for the error code, click a number under Error Code. To view the Jobs Affected with Error Codes Report, click a number under Jobs Affected. To view the Top 10 Errors in Last 24 Hours Report, click Top 5 Errors in Last 24 Hours. |