The CommCell Dashboard displays a preview of the most critical information gathered from the CommCell computer. Use the CommCell Dashboard to monitor CommCell performance from a high level on the Cloud Services Portal.
Many windows on the Dashboard open more detailed reports that you can use to analyze the collected statistics.
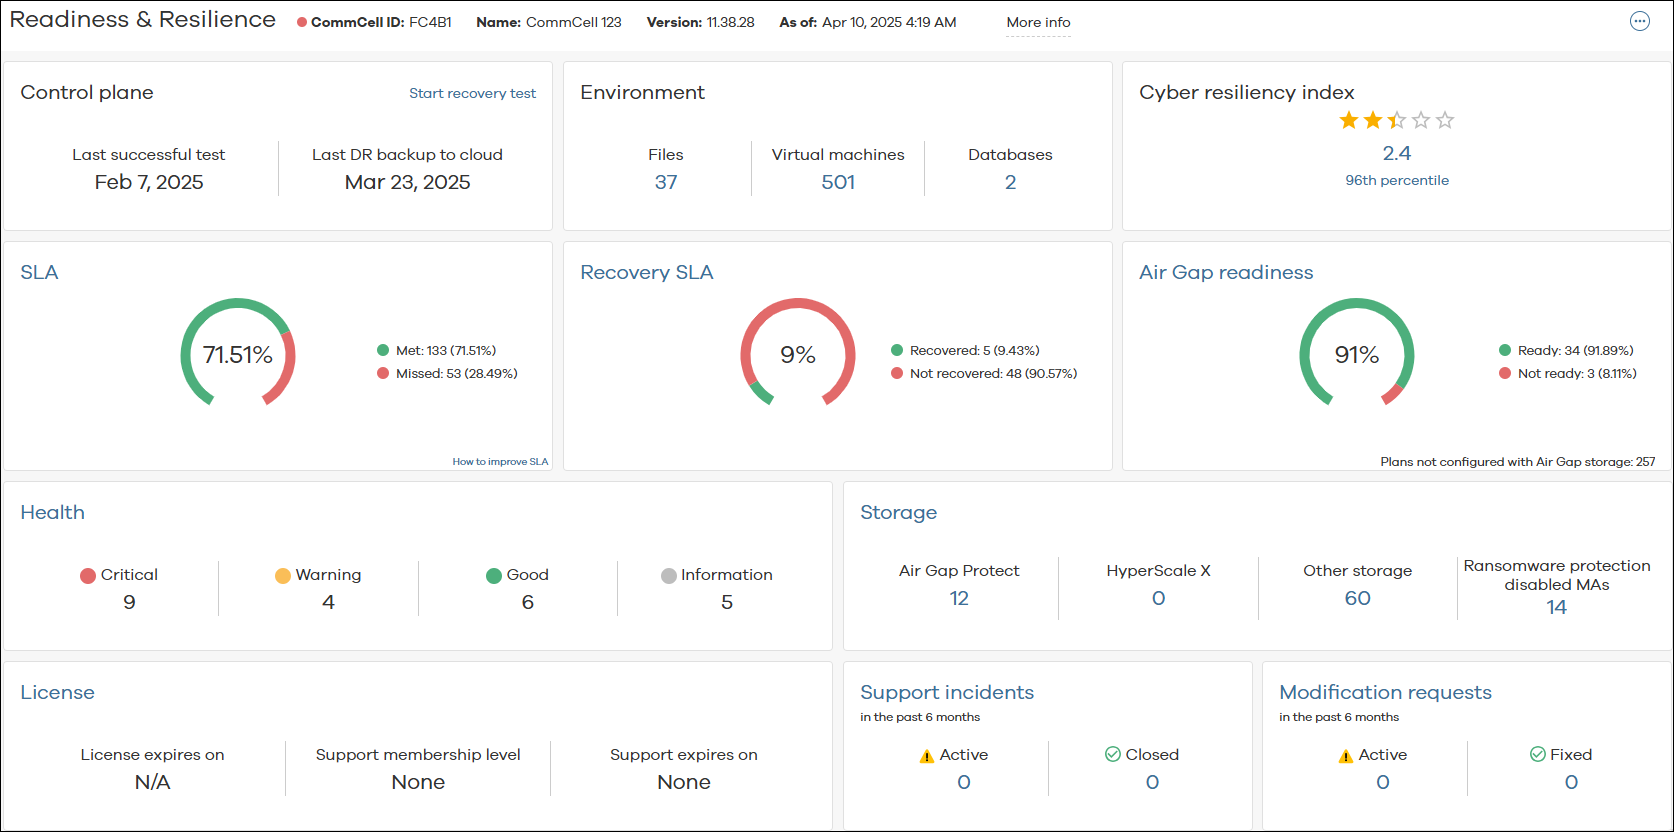
The following table includes descriptions for all of the tiles that are visible on the CommCell Dashboard.
|
Tile |
Description |
|---|---|
|
Control plane |
Displays the date of the latest successful recovery test from the latest completed job, as well as the date of the latest successful DR backup upload to the cloud. You can initiate various recovery operations and view details by clicking Start recovery test. For more information, see Cleanroom recovery for cyber resilience. |
|
Environment |
Displays the number of file servers, virtual machines, and databases in the CommCell environment. Click a specific entity number to view the status details. |
|
Cyber resiliency index |
Displays the score based on factors such as defense and recovery strategies, security measures, and the identification of cyber threats to prevent data loss. The percentile value is calculated based on the highest-rated CommCell environment. |
|
SLA |
Displays the percentage of all client computers that met or missed Service Level Agreement (SLA) at the last time data was collected. The formula used to calculate SLA is: Number of Clients that Met SLA / Total Number of Clients, at the time of data collection, regardless of the SLA time period configured for that particular client. To view the SLA Details Report, click SLA. The following are the options to display the list of server in pending action status: Customer Action Pending: The servers or subclients excluded from SLA by the customer. Service Provider Action Pending: The servers or subclients excluded from SLA by the MSP. Note: The above options are displayed only when the user is having a server in any one of the above pending action category. |
|
Recovery SLA |
Displays the percentage of cleanroom recovery entities recovered in the last 30 days that met and missed the SLA. |
|
Air Gap readiness |
Displays the overall status of auxiliary copy jobs for air gap copies, considering data size to be copied, number of jobs to be copied, and days delayed. It also shows the number of copies not configured as air gap protect, and the oldest date of copy fallen behind. Click on the tile to view additional details. |
|
Health |
Displays the number of tiles that are in Good, Warning, or Critical state for each category of the Health Report. To view more detailed information about each category in the Health Report, click Health. |
|
Storage |
Displays the counts for Air Gap Protect, HyperScale X, and other storages (including disk, cloud, tape, etc.), as well as counts for any storage nearing maximum capacity within the next three months. It also highlights count for Ransomware Protection Disabled MediaAgent. Clicking on an entity count provides additional details. |
|
License |
The number of servers, laptops, VMs, and users, the amount of space being used in disk libraries, and the size of deduplicated data. |
|
Support and Services |
Indicates your organization's membership level and service expiration date. |
|
Support incidents |
Displays the number of active and closed support incidents during the specified time period. To view the Support Incidents Report, click Support Incidents. |
|
Modification Requests |
Displays the number of requests submitted for a change in the software during the specified time period. To view the Customer Modification Request Report V2, click Modification Requests. |