The File type tab in the Threat Indicators dashboard lists Windows file system clients with file type anomalies in backup jobs.
Clicking a client computer opens the File Type Report, which allows you to analyze the statistics for that client.
The File Type Report tracks files that have a mismatch between the file type metadata and the file extension. A file type mismatch may occur if the file is encrypted or corrupted by malware attacks.
The anomaly check is supported for the following file extensions:
- .7z
- .acl
- .bz2
- .cab, .com, .csv
- .dll, .dmg, .doc, .docm, .docx, .dot, .dotm, .dotx
- .eml, .emlx, .exe
- .gz
- .ipa
- .jar
- .mbox, .mpd, .mpp, .mpt, .msf, .msg, .msi
- .nsf
- .odg, .odp, .ods, .odt, .one, .ops
- .pa, .pages, .pdf, .pgs, .pkg, .pot, .potm, .pots, .ppa, .ppam, .pps, .ppsm, .ppsx, .ppt, .pptm, .pptx, .pub
- .rar, .rdf, .rpm
- .sldm, .sldx, .so
- .tar, .toast, .tsv
- .vcd, .vmdk, .vsdm, .vsdx, .vss, .vssm, .vssx, .vstm, .vstx
- .wbk
- .xl, .xla, .xlam, .xll, .xlm, .xls, .xlsb, .xlsm, .xlsx, .xlt, .xltm, .xltx, .xml, .xz
- .zip
The anomaly check is performed on backup jobs that have been file indexed. The backup jobs are checked every 4 hours for any file type anomaly and the files are flagged in the index server. The threshold value to report the anomaly is calculated based on the percentage of anomaly files in the previous job +5%. Consider the following examples:
-
Job 1: There are 100 files and 2 files are marked as invalid MIME. Because this is the first job, no anomaly is reported.
-
Job 2: There are 100 files, and 4 files are marked as invalid MIME. The threshold value is 5% + 2% (from previous job) = 7%. Because the number of anomaly files is less than the threshold value, no anomaly is reported for this job.
-
Job 3: There are 100 files, and 15 files are marked as invalid MIME. The threshold value is 5% + 4% (from previous job) = 9%. The number of anomaly files is greater than the threshold value. An anomaly entry is reported, and the systeme sends an anomaly alert to the CommCell administrator and displays an event message in the CommCell Console.
When the number of files with the anomaly exceed 10% of the total number of files backed up, the software sends an anomaly alert to the CommCell administrator and displays an event message in the CommCell Console.
The following options are available in the upper-right corner of the page in the report:
-
To clear anomalies of a client with unusual file activity, from the client list in the report, click Delete anomaly.
-
To recover a client that has unusual file activity, as a VM, click Recover as VM.
The file version prior to the anomaly is recovered.
-
To restore a file from a client that has unusual file activity, click Recover files.
The file version prior to the anomaly is recovered.
File Type Tab
The table in the File type tab is comprised of the following columns:
|
Column |
Description |
|---|---|
|
Name |
The client computer. When you click the client computer, the File Type Report appears (see below), which allows you to analyze the statistics for that client. |
|
Indicators |
File type |
|
Detected time |
The time when the anomaly was detected. |
|
Server type |
The type of server identified. |
|
File Count |
Number of files detected with the anomaly. |
|
Tags |
Audit tags that you can use to record actions. |
|
Actions |
Click the action button
|
 , and then select one of the following options:
Report Description
Click a client name in the File Type tab to open the File Type Report for file type anomalies in backup jobs.
The File Type Report is divided into the following sections: File Type chart and Suspicious Files table.
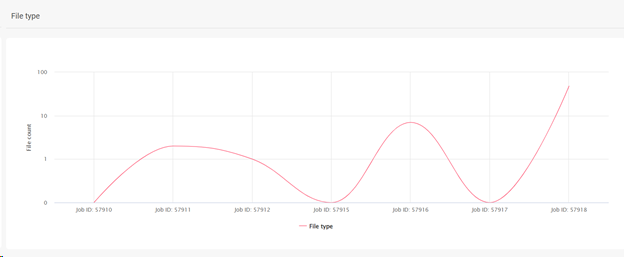
File Type Chart
The File Type chart displays the number of anomalies in each backup job.
The following image is an example of the File Type chart for file type anomalies in backup jobs:
Suspicious Files Table
The following table includes descriptions of all columns in the Suspicious Files table.
|
Column |
Description |
|---|---|
|
File name |
The file name of the affected file. |
|
Path |
The path to the affected file. |
|
Size |
The size of the affected file. |
|
Detected time |
The time when the anomaly was detected. |
|
Actions |
|