Components are report elements, such as tables and charts that display data. While you collect raw data using data sets, you can display that data in a meaningful way using components. There are a variety of charts, tables, and other components that you can use to create reports.
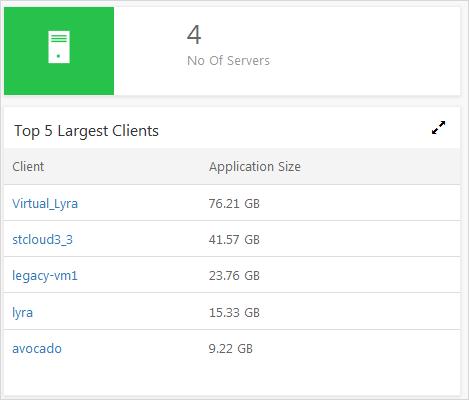
Tables
Tables are the basic building blocks of any report. They display text in a format that is easy to scan and understand. You can use tables to provide detailed information collected from the data sets that you create.
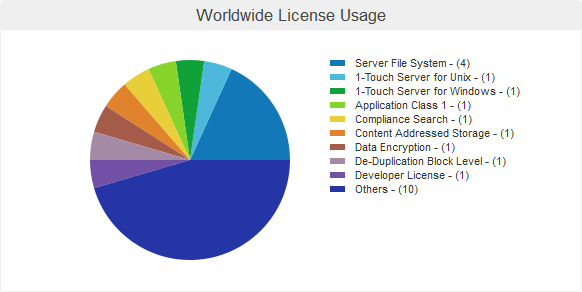
Charts
Use charts to display summary information in pictorial format. This image is an example of a pie chart:
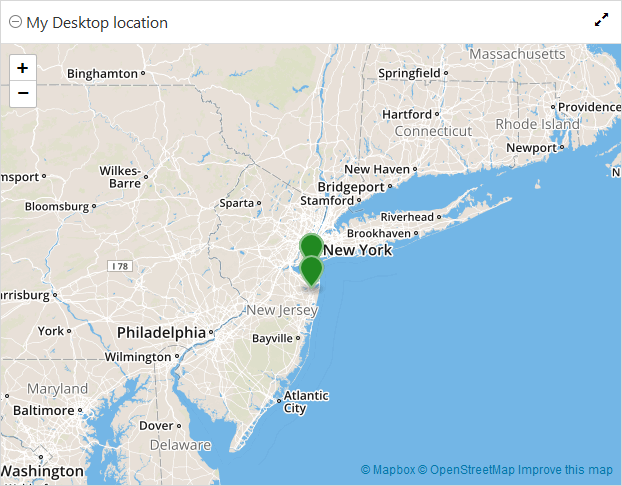
Components
Use the map component to display geographical information and use the HTML component type to control the display using your own HTML code.
This image is an example of the map component:
This image is an example of two different HTML components: