You can use the Email Analytics report to locate outdated emails, emails with large attachments, or large mailboxes on your email server.
View Email Analytics Reports from the Web Console
After running an analytics job, you can view the Email Analytics Report from the Web Console.
Before You Begin
Your administrator must have configured your user credentials to view Data Analytics reports in the Web Console. For more information, see User Requirements for Viewing Data Analytics Reports.
Procedure
-
Log on to the Web Console.
-
Click Analytics.
-
Click Email Analytics.
A list of available reports appears.
From here, you can:
|
Use the Email Analytics Report to... |
Refer to... |
|
view a summary of information for data on a specific client or client group, including space usage by:
|
|
|
outdated emails, which can be deleted or moved to secondary storage |
|
|
emails with large attachments |
|
|
large mailboxes |
View Summary Information for an Email Server
You can view a summary of information for the data residing on a specific email server with the Email Analytics report. The summary contains information regarding space usage distribution by:
-
Received Time
-
Email Size
-
Has Attachment
To view summary information for an email server:
-
Under Email Server, click the name of the server you want to view.
The summary report for the selected email server appears.
-
To view more detailed information for the selected email server, click Interactive to access the complete analytics report.
Analyze Outdated Emails
To analyze outdated emails, view the Space Usage Distribution by Received Time data view.
-
In the Email Analytics screen under the Action column, click Analytics for the email server you want to view.
The Space Usage by Received Time data view appears.
-
To further analyze the information in the report, proceed as follows:
If you want to...
Then...
view detailed data information for data in a specific range
- Point to a bar on the graph.
filter the current data view by mailbox owner
-
Click the Filter
 button.
 -
Select the mailboxes to include in the data view.
-
Click Apply.
filter the current data view by attachments
-
Click the Filter
button. -
Select the attachment filters to include in the data view.
-
Click Apply.
modify the data ranges (y-axis)
-
Click the Customize Categories
 button.
From here, you can:
-
Type or select new values of a range to display in the graph.
-
Remove a range by clicking the minus
 button.
 -
Add a range by clicking the plus
 button, up to a maximum of 6.
-
-
Click Apply to save your changes and update the graph.
view more granular data information for a specific range
-
Click on a y-axis value.
More granular data for the selected range appears.
For example, from the default Received Time data view, click Less than 1 year to view a quarterly distribution of the data in the selected range.
view a detailed list of data included in the current view
-
Click the Mailbox View button
 .
.The Listing View appears with the following information:
-
Mailbox owners
-
The size of each mailbox in the current data view
Information in the listing view can be sorted by clicking on the column titles.
-
approximate savings of archiving items in the current data view
-
In the Cost in $ box below the data view, enter your storage costs (in dollars per GB).
The Save Approx value updates to reflect the amount you could save by moving data in the current data view to archival storage.
Analyze Emails with Attachments
To analyze emails with attachments, use the Space Usage Distribution by Attachment data view.
-
In the Email Analytics screen under the Action column, click Analytics for the email server you want to view.
The Space Usage by Received Time data view appears.
-
Click a bar on the graph to view size information for email data within a specific received time range.
Note
If you want to view size information for all email data, first create a category that will capture all email data:
Click the Custom Categories
button.Create a date range of Beyond 0 Years.
Click the bar on the graph for Beyond 0 Years.
The Space Usage Distribution by Email Size data view appears.
-
Click a bar on the graph to view attachment information for email data within a specific size range.
Note
If you want to view attachment information for all email data, first create a category that will capture all email data:
Click the Custom Categories
button.Create a date range of Below 1000 GB.
Click the bar on the graph for Below 1000 GB.
The Space Usage Distribution by Attachment data view appears.
-
To further analyze the information in the report, proceed as follows:
If you want to...
Then...
view detailed data information for data in a specific range
- Point to a bar on the graph.
filter the current data view by mailbox owner
-
Click the Filter
button. -
Select the mailboxes to include in the data view.
-
Click Apply.
view a detailed list of data included in the current view
-
Click the Mailbox View button
.The Listing View appears with the following information:
-
Mailbox owners
-
The size of each mailbox in the current data view
Information in the listing view can be sorted by clicking on the column titles.
-
approximate savings of archiving items in the current data view
-
In the Cost in $ box below the data view, enter your storage costs (in dollars per GB).
The Save Approx value updates to reflect the amount you could save by moving data in the current data view to archival storage.
Analyze Mailboxes
To analyze files by type, use the Listing View.
-
In the Email Analytics screen under the Action column, click Analytics for the email server you want to view.
The Space Usage by Received Time data view appears.
-
Click the Mailbox View button
.The Listing View appears with the following information:
-
The mailbox owner of each email
-
The size of each mailbox in the current data view
-
Viewing Reports for Proxy Clients
You can view Email Analytics report for a proxy client by changing the URL of the report.
-
In the Web Console, open the Email Analytics reports.
-
Add &proxyClient=true to the end of the URL of the Email Analytics report. For example:
http://<WebConsole>/webconsole/cireports.index.jsp?component=exchClients&proxyClient=true.
WebConsole is the name of the machine where the Web Console is installed.
The list of proxy client Email Analytics reports appears.
Email Analytics Data Views
The following data views are available for the Email Analytics report:
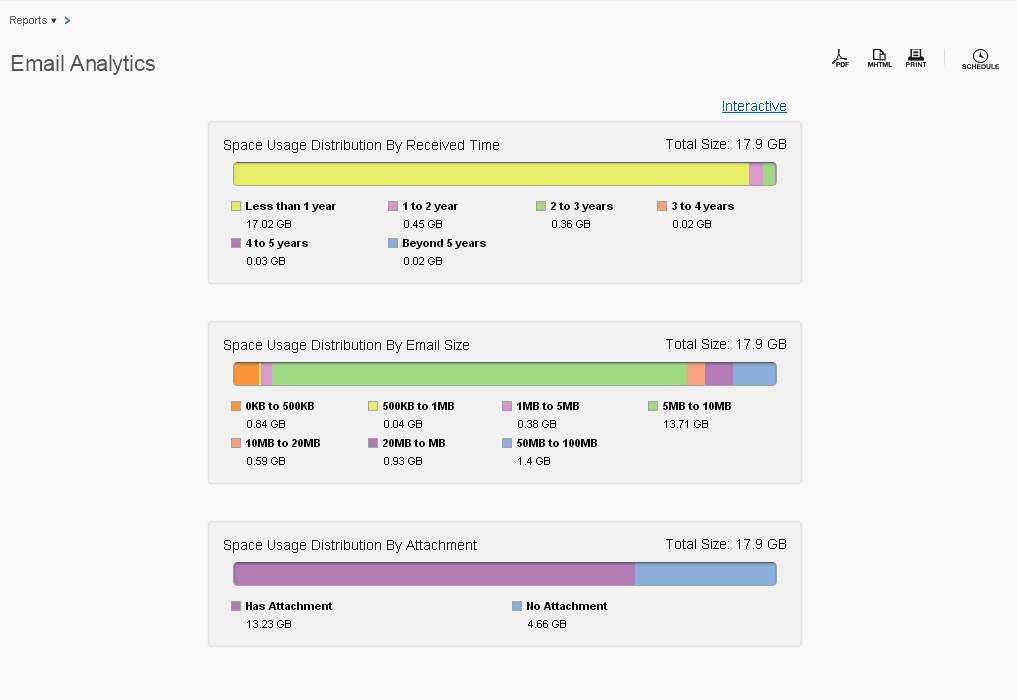
Email Server Summary
The Summary data view displays summary information for the selected email server about the space usage distribution by:
-
Received Time
-
Email Size
-
Has Attachment
- Click Interactive to view the Space Usage Distribution by Received Time data view.
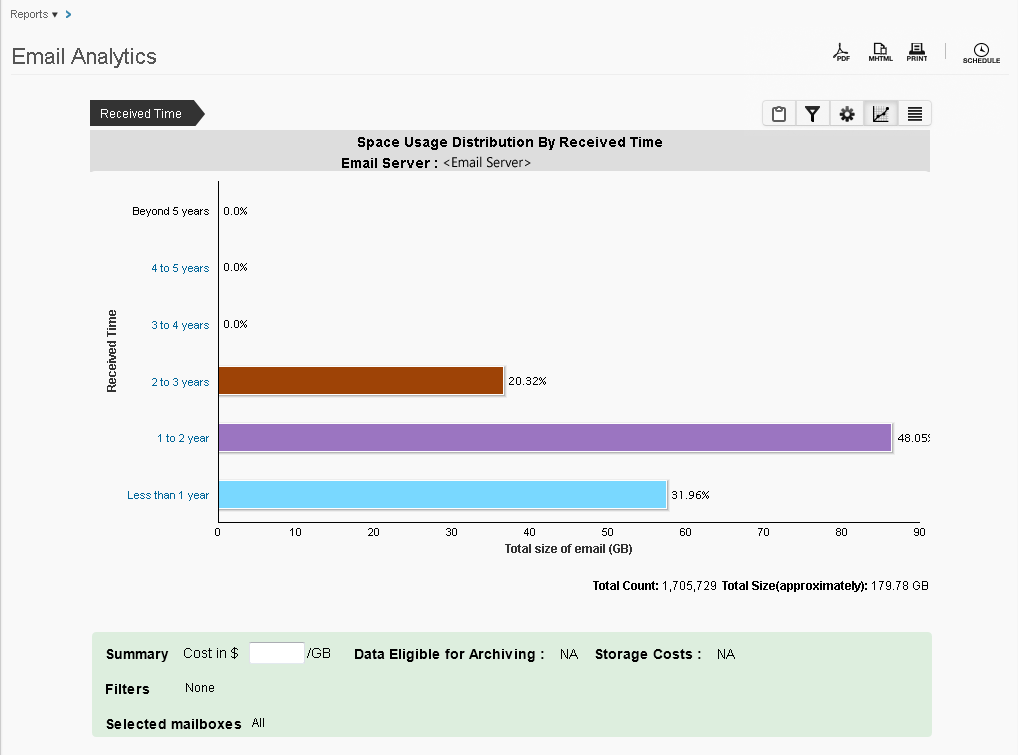
Received Time
The Received Time data view displays information in the y-axis in categories according to when emails were received and the x-axis according to the total size of emails in each category.
In the Received Time data view, you can:
-
Point to a section of the graph to view the total size of emails in that category
-
Modify the categories in the y-axis by clicking the Customize Categories button
-
View more granular data by clicking on a section of the graph
-
View more granular data by clicking on a y-axis category
-
Click the Additional Filters button to view specific mailboxes
-
Enter your secondary storage costs into the Cost in $ /GB box to approximate the cost of archiving data in the current view
Email Size
The Email Size data view displays information in the y-axis in categories according to the sizes of individual emails and the x-axis according to the total size of emails in each category.
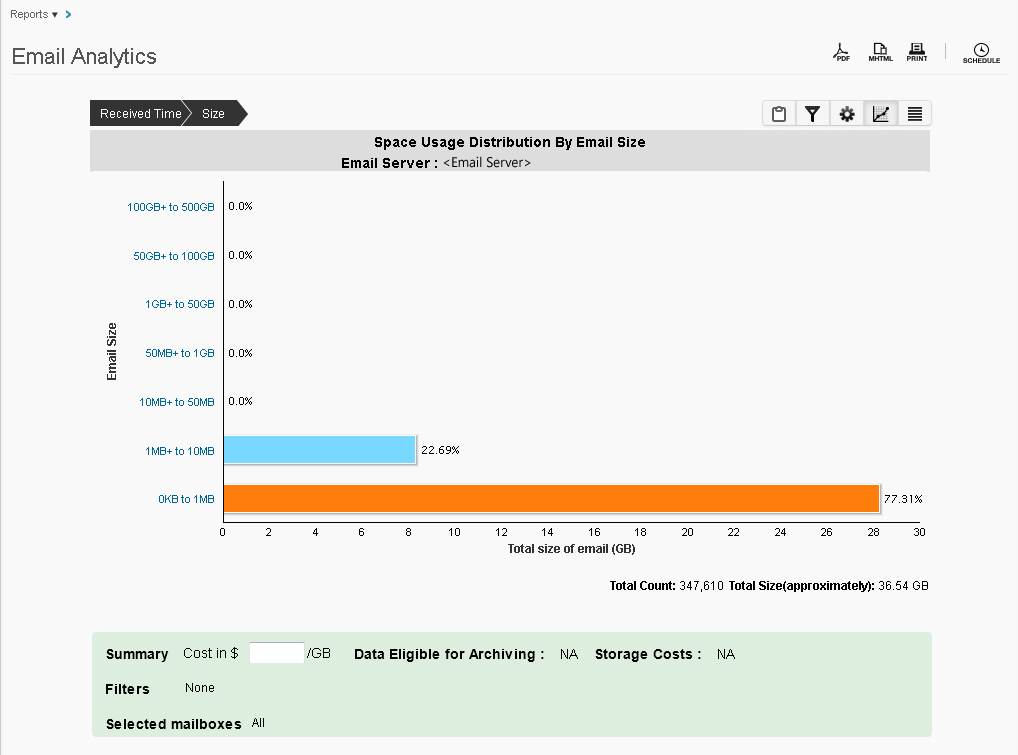
In the Email Size data view, you can:
-
Point to a section of the graph to view the total size of emails in that category
-
Modify the categories in the y-axis by clicking the Customize Categories button
-
View more granular data by clicking on a section of the graph
-
View more granular data by clicking on a y-axis category
-
Click the Additional Filters button to view specific mailboxes
-
Enter your secondary storage costs into the Cost in $ /GB box to approximate the cost of archiving data in the current view
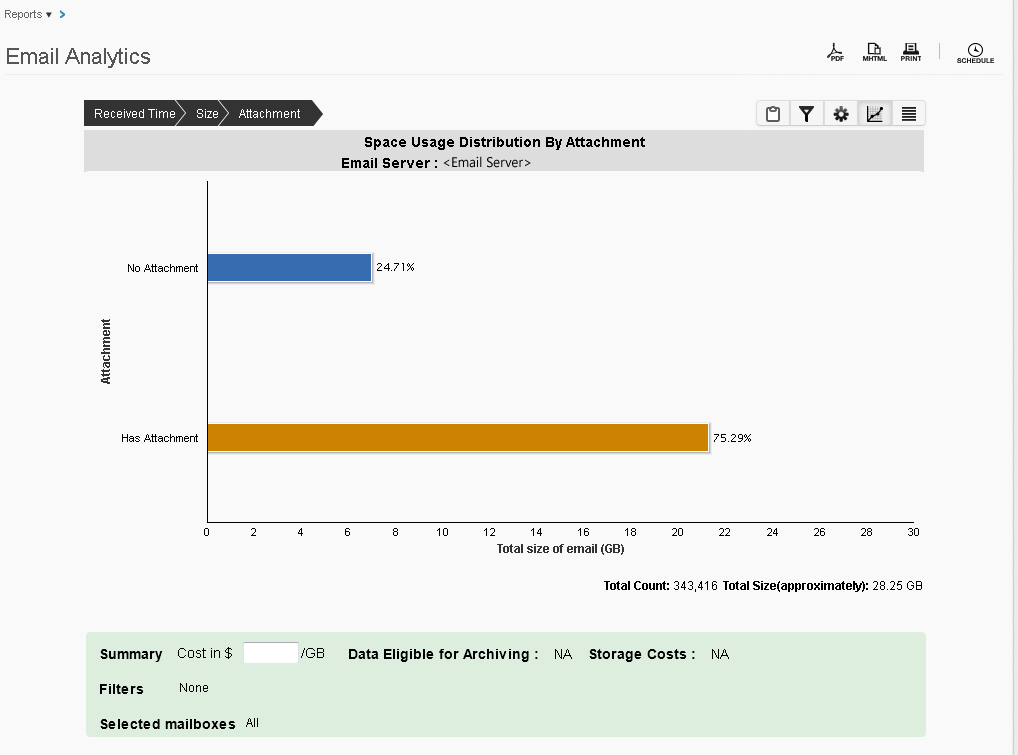
Attachment
The Attachment data view displays information in the y-axis in categories according whether an email has an attachment or not and the x-axis according to the total size of emails in each category.
-
Point to a section of the graph to view the total size of emails in that category
-
View more granular data by clicking on a section of the graph
-
Click the Additional Filters button to view specific mailboxes
-
Enter your secondary storage costs into the Cost in $ /GB box to approximate the cost of archiving data in the current view