The following procedure is a real example of how to build the Backup Status Report.
Before You Begin
To add remote CommServe computers or external databases as data sources, see Adding Remote CommServe Computers as Data Sources and Configuring External Data Sources.
Procedure
-
On Web Console, click Reports.
The Reports page appears.
-
From the navigation pane, click Configuration > Reports, and then click New Report.
The Report Builder page appears.
-
On the Reports tab, in the Report Name box, type Backup Failures, and in the Description box, type Includes information about the backup jobs that failed in each CommCell environment.
-
On the Dataset tab, click Add
 , and then configure the settings:
 -
In the Add Data Set dialog box, on the Query tab, select Database.
-
In the Data Set Name box, type BackupInfo.
-
In the Data Sources list, select Local (CommCell Name) , and in the Databases list, select CommServ.
-
Select Views, and in the list, select dbo.CommCellClientLevelBkpJobSummary.
-
Click Preview to collect the field names that you can use as columns in your report.
-
Click the Advanced tab, and in the Time Out box, type 10.
-
Click Done.
-
-
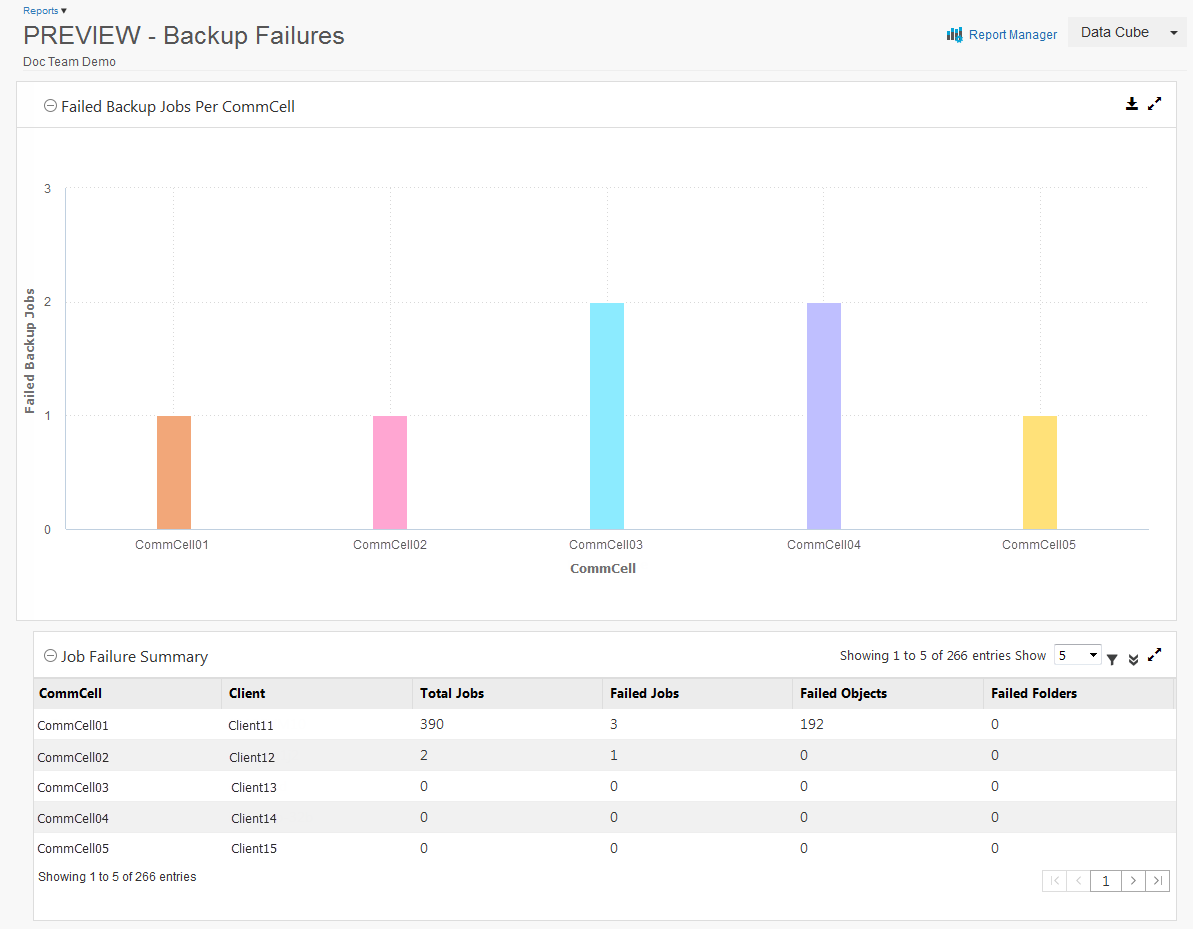
From the Visualization tab, drag Data Table to the Drop components to build the report box.
-
From the Data Set list, drag field names to the Data Table:
-
Data Source
-
ClientName
-
TotalJobs
-
Failed
-
FailedObjects
-
FailedFolders
-
-
Select the table, and on the Properties tab, click General
 .
. -
In the Title box, type Job Failure Summary.
-
-
On the Properties tab, click Fields
 , and then configure sorting and column names:
 -
Next to Sorting, click Add Sorting
 , select Failed Jobs from the list, and then select Desc.
The data in the table is sorted by the number of Failed Jobs in descending order.
-
Expand each Field Name section, and in the Display Name box, type a name for the column:
-
CommCell
-
Client
-
Total Jobs
-
Failed Jobs
-
Failed Objects
-
Failed Folders
-
-
-
From the Visualization tab, drag Vertical Bar Chart to the Drop components to build the report box.
-
From the Data Set list, drag Failed to the Drop Y-Axis box.
-
From the list under Drop Y-Axis, select Distinct.
-
From the Data Sets list, drag Data Source to the Drop X-Axis box.
The chart you created appears in the report builder.
-
On the Properties tab, click General
, and configure the chart titles: -
In the Chart Title box, type Failed Backup Jobs Per CommCell.
-
In the Y-Axis Title box, type Failed Backup Jobs.
-
In the X-Axis Title box, type CommCell.
-
-
-
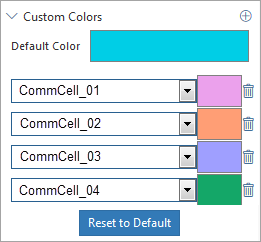
On the Properties tab, click click Fields
and configure custom colors for the bars: -
Next to Custom Colors, click Customize Series Colors
 .
. -
Select each X-Axis from the list, and then click the box next to it.
-
Click the Default Color box, select a color from the Color dialog box, and then click OK.
Any bar that is not configured with a custom color displays the color configured in the Default Color box.
-
-
Click Preview to see what the report will look like.
-
At the top of the page, click Save, and then click Deploy.
The report appears on the Worldwide Reports page under Untagged.