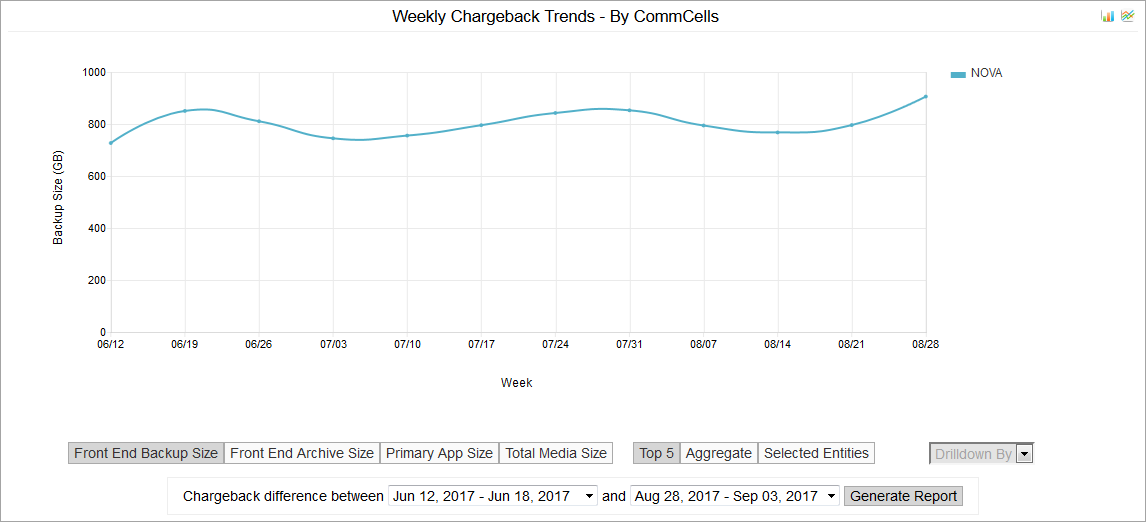
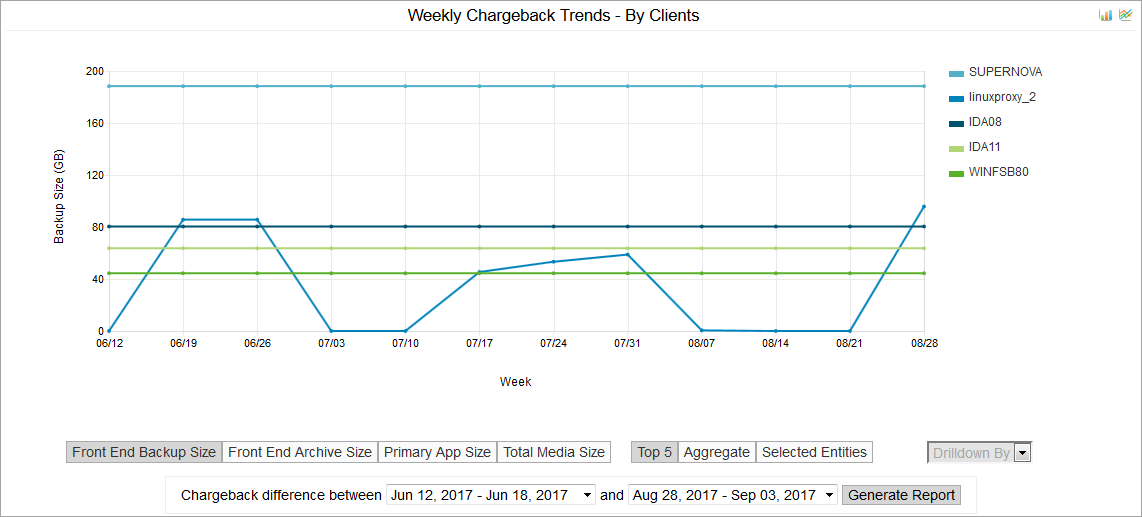
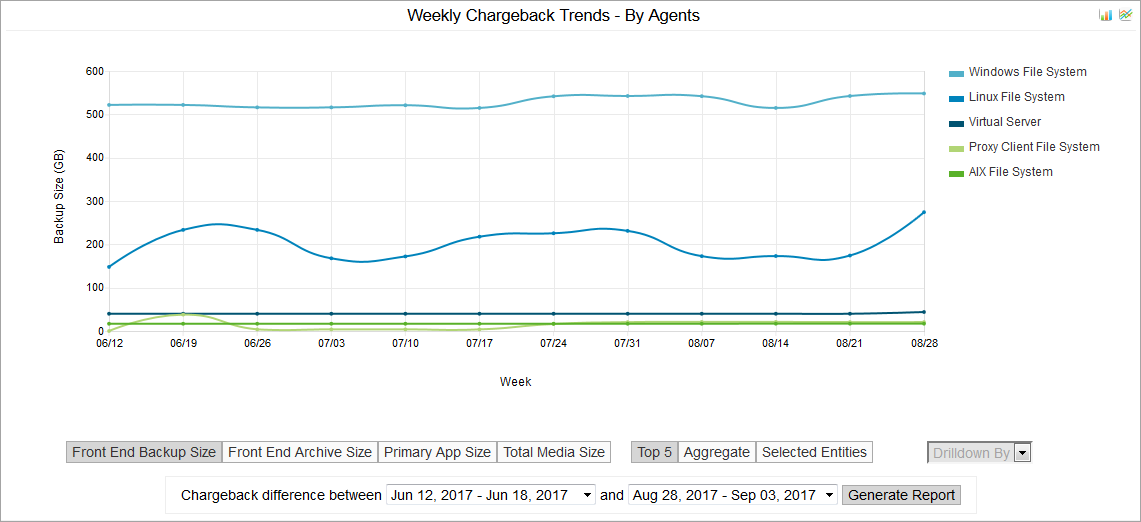
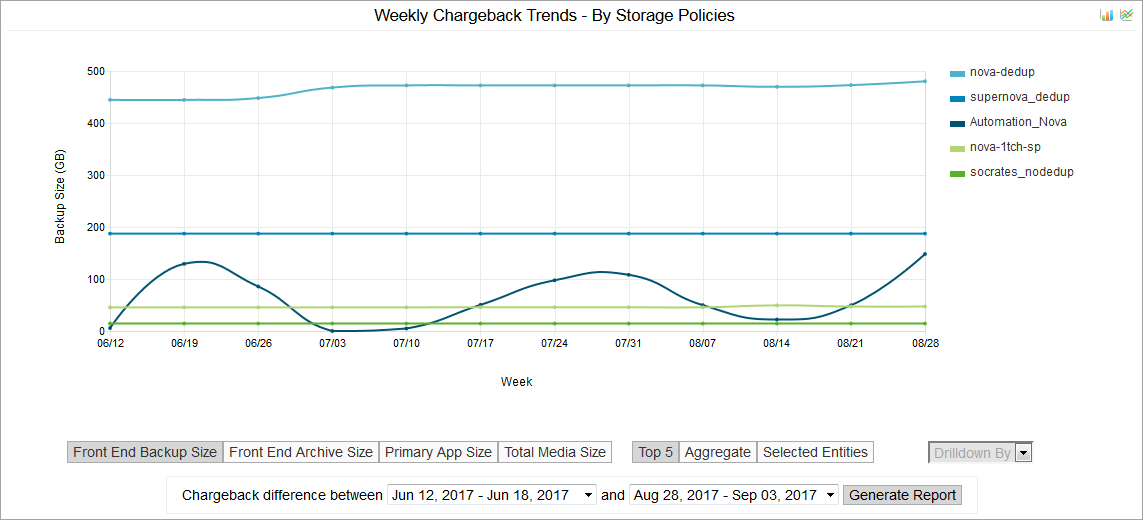
These charts display information about size of data that was backed up, archived, and stored on media in this CommCell environment. You can view sizing data over the last year in monthly, weekly or daily increments, depending on the time range you selected on the Chargeback Report.
To view this report:
-
In the Chargeback Trends Report, next to an entity chart, click Details
 .
.Your selections in the Chargeback Report determine the data you see in the trending charts.
CommCells
This chart and table can display the front end backup size, front end archive size, primary app size, or total media size. The chart can display data size only as an aggregate for the entire CommCell environment. When you select a type of data size, such as Primary App Size, the data in the details table changes to match your selection. View the chart data in compound bar format by clicking Bar  or in line format by clicking Line
  .
.
To compare the size between two time periods, specify a time period:
-
Next to Chargeback difference between, select a month, week, or date from each list, and then click Generate Report.
The Monthly, Weekly, or Daily Chargeback Difference by CommCell Report appears.
Chargeback Trends by CommCells Chart
The Weekly Chargeback Trends by CommCells chart displays the amount of backup data over time.

This table explains the data included in each view in the chart.
|
View |
Description |
|---|---|
|
Front End Backup Size |
The amount of data in the largest full backup job from each subclient during the specified time period. If no full backup job completed during the specified time period, then it is the amount of data in the largest full backup job from the previous time period. This report calculates the amount of data only in the primary copy. For VMs, this is the largest guest size in the most recent full backup. For clients that have both VSA and other agents installed, only the front end size for VSA subclients is displayed. Jobs that run on a VM are counted only one time, regardless of the number of subclients that were used to back up the virtual machine. Deconfigured clients are not included in the Front End Terabytes (FET), and a value of 0 appears in the report. If an agent has multiple backup sets, the backup set with the largest backup size counts towards FET. |
|
Front End Archive Size |
The amount of data in all archive jobs from each subclient. This report calculates the amount of data only in the primary copy. Jobs that run on a VM are counted only one time, regardless of the number of subclients that were used to back up the virtual machine. If an agent has multiple backup sets, the backup set with the largest backup size counts towards FET. The following types of data are included:
Virtual server agents: The guest VM size is measured to calculate capacity. For more information, see Virtual Machines in the Capacity Calculation. |
|
Primary App Size |
The amount of application data, before compression and deduplication, that was written to primary copies, including aged data and pruned data, during the specified time period. For VMs, the application size is the backup size. For more information, see Size Measures for Virtual Machines. |
|
Total Media Size |
The amount of all active data that is saved on storage media, including all storage policy copies on all media types, and excluding aged data. For storage policy copies that have deduplication enabled, the media size for each job is calculated based on the average deduplication ratio of the copy. Where media size = application size * average deduplication ratio per copy. The average deduplication ratio of a destination copy is calculated by (total size on disk)/(total protected app size) for the destination copy. |
|
Top 5 |
Not applicable for CommCell entities at the CommCell level. |
|
Aggregate |
Always displayed for CommCell entities at the CommCell level. |
|
Selected Entities |
Not applicable for CommCell entities at the CommCell level. |
Details Table
This table displays the name of the CommCell environment and the front end backup size, front end archive size, primary app size, and total media size, depending on your selection in the chart.
|
Column |
Description |
|---|---|
|
CommCell Name |
The CommServe computer. To go to the Dashboard for that particular CommCell environment, click the CommCell Name. |
|
Latest Size |
Size based on the most recently collected data. You can view data in daily, weekly, or monthly increments. For example, if you are viewing data in weekly increments, this value is the data size for the current week. |
|
Latest Size Change |
Difference between the most current size, and the size before that. For example, if you are viewing data sizes in weekly increments, this value is the difference between data size from the current week and the data size from last week. |
|
Latest Size Change (%) |
Percentage of difference in size between the most current size, and the size before that, For example, if you are viewing data sizes in weekly increments, this value is the percentage of difference between data size from the current week and the data size from last week. |
|
Day/Week/Month |
Displays the size of data for each day, week, or month, based on the selection you make in the chart. |
Clients
This chart and table can display the front end backup size, front end archive size, primary app size, or total media size. The chart can display data size for the five largest clients, as an aggregate, or for the entities you select. When you select a type of data size, such as Primary App Size, the data in the details table changes to match your selection. View the chart data in compound bar format by clicking Bar  or in line format by clicking Line
  . You can also choose to view the data size for the top 5 clients, the aggregate data size for all clients, or view data for particular clients by selecting them from the Client column in the table.
To compare the size between two time periods, specify a time period:
-
Next to Chargeback difference between, select a month, week, or date from each list, and then click Generate Report.
The Monthly, Weekly, or Daily Chargeback Difference by Clients Report appears.
Chargeback Trends by Clients Chart
The Weekly Chargeback Trends by Clients chart displays the amount of backup data over time.

This table explains the data included in each view in the chart.
|
View |
Description |
|---|---|
|
Front End Backup Size |
The amount of data in the largest full backup job from each subclient during the specified time period. If no full backup job completed during the specified time period, then it is the amount of data in the largest full backup job from the previous time period. This report calculates the amount of data only in the primary copy. For VMs, this is the largest guest size in the most recent full backup. For clients that have both VSA and other agents installed, only the front end size for VSA subclients is displayed. Jobs that run on a VM are counted only one time, regardless of the number of subclients that were used to back up the virtual machine. Deconfigured clients are not included in the Front End Terabytes (FET), and a value of 0 appears in the report. If an agent has multiple backup sets, the backup set with the largest backup size counts towards FET. |
|
Front End Archive Size |
The amount of data in all archive jobs from each subclient. This report calculates the amount of data only in the primary copy. Jobs that run on a VM are counted only one time, regardless of the number of subclients that were used to back up the virtual machine. If an agent has multiple backup sets, the backup set with the largest backup size counts towards FET. The following types of data are included:
Virtual server agents: The guest VM size is measured to calculate capacity. For more information, see Virtual Machines in the Capacity Calculation. |
|
Primary App Size |
The amount of application data, before compression and deduplication, that was written to primary copies, including aged data and pruned data, during the specified time period. For VMs, the application size is the backup size. For more information, see Size Measures for Virtual Machines. |
|
Total Media Size |
The amount of all active data that is saved on storage media, including all storage policy copies on all media types, and excluding aged data. For storage policy copies that have deduplication enabled, the media size for each job is calculated based on the average deduplication ratio of the copy. Where media size = application size * average deduplication ratio per copy. The average deduplication ratio of a destination copy is calculated by (total size on disk)/(total protected app size) for the destination copy. |
|
Top 5 |
Displays the top 5 largest clients in the CommCell environment. |
|
Aggregate |
Displays the aggregate calculation for the entire CommCell environment. |
|
Selected Entities |
Click Selected Entities, and then in the table, select the clients that you want to view. |
Details Table
This table displays the name of each client in the CommCell environment and the front end backup size, front end archive size, primary app size, and total media size, depending on your selection in the chart.
|
Column |
Description |
|---|---|
|
Entity Name |
Name of the client. You can click the client name to view Chargeback Trends Report for only this client. |
|
Latest Size |
Size based on the most recently collected data. You can view data in daily, weekly, or monthly increments. For example, if you are viewing data in weekly increments, this value is the data size for the current week. |
|
Latest Size Change |
Difference between the most current size, and the size before that. For example, if you are viewing data sizes in weekly increments, this value is the difference between data size from the current week and the data size from last week. |
|
Latest Size Change (%) |
Percentage of difference in size between the most current size, and the size before that, For example, if you are viewing data sizes in weekly increments, this value is the percentage of difference between data size from the current week and the data size from last week. |
|
Day/Week/Month |
Displays the size of data for each day, week, or month, based on the selection you make in the chart. |
Agents
This chart and table can display the front end backup size, front end archive size, primary app size, or total media size. The chart can display data size for the five largest agents, as an aggregate, or for the agents you select. When you select a type of data size, such as Primary App Size, the data in the details table changes to match your selection. View the chart data in compound bar format by clicking Bar  or in line format by clicking Line
  . You can also choose to view the data size for the top 5 clients, the aggregate data size for all clients, or view data for particular clients by selecting them from the Agent column in the table.
To compare the size between two time periods, specify a time period:
-
Next to Chargeback difference between, select a month, week, or date from each list, and then click Generate Report.
The Monthly, Weekly, or Daily Chargeback Difference by Clients Report appears.

This table explains the data included in each view in the chart.
|
View |
Description |
|---|---|
|
Front End Backup Size |
The amount of data in the largest full backup job from each subclient during the specified time period. If no full backup job completed during the specified time period, then it is the amount of data in the largest full backup job from the previous time period. This report calculates the amount of data only in the primary copy. For VMs, this is the largest guest size in the most recent full backup. For clients that have both VSA and other agents installed, only the front end size for VSA subclients is displayed. Jobs that run on a VM are counted only one time, regardless of the number of subclients that were used to back up the virtual machine. Deconfigured clients are not included in the Front End Terabytes (FET), and a value of 0 appears in the report. If an agent has multiple backup sets, the backup set with the largest backup size counts towards FET. |
|
Front End Archive Size |
The amount of data in all archive jobs from each subclient. This report calculates the amount of data only in the primary copy. Jobs that run on a VM are counted only one time, regardless of the number of subclients that were used to back up the virtual machine. If an agent has multiple backup sets, the backup set with the largest backup size counts towards FET. The following types of data are included:
Virtual server agents: The guest VM size is measured to calculate capacity. For more information, see Virtual Machines in the Capacity Calculation. |
|
Primary App Size |
The amount of application data, before compression and deduplication, that was written to primary copies, including aged data and pruned data, during the specified time period. For VMs, the application size is the backup size. For more information, see Size Measures for Virtual Machines. |
|
Total Media Size |
The amount of all active data that is saved on storage media, including all storage policy copies on all media types, and excluding aged data. For storage policy copies that have deduplication enabled, the media size for each job is calculated based on the average deduplication ratio of the copy. Where media size = application size * average deduplication ratio per copy. The average deduplication ratio of a destination copy is calculated by (total size on disk)/(total protected app size) for the destination copy. |
|
Top 5 |
Displays the top 5 largest agents in the CommCell environment. |
|
Aggregate |
Displays the aggregate calculation for the entire CommCell environment. |
|
Selected Entities |
Click Selected Entities, and then in the table, select the agents that you want to view. |
Details Table
This table displays the name of each agent type in the CommCell environment and the front end backup size, front end archive size, primary app size, and total media size, depending on your selection in the chart.
|
Column |
Description |
|---|---|
|
Entity Name |
Name of the agent. You can click the agent name to view Chargeback Trends Report for only this agent type. |
|
Latest Size |
Size based on the most recently collected data. You can view data in daily, weekly, or monthly increments. For example, if you are viewing data in weekly increments, this value is the data size for the current week. |
|
Latest Size Change |
Difference between the most current size, and the size before that. For example, if you are viewing data sizes in weekly increments, this value is the difference between data size from the current week and the data size from last week. |
|
Latest Size Change (%) |
Percentage of difference in size between the most current size, and the size before that, For example, if you are viewing data sizes in weekly increments, this value is the percentage of difference between data size from the current week and the data size from last week. |
|
Day/Week/Month |
Displays the size of data for each day, week, or month, based on the selection you make in the chart. |
Storage Policies
This chart and table can display the front end backup size, front end archive size, primary app size, or total media size. The chart can display data size for the five largest storage policies, as an aggregate, or for the storage policies you select. When you select a type of data size, such as Primary App Size, the data in the details table changes to match your selection. View the chart data in compound bar format by clicking Bar  or in line format by clicking Line
  . You can also choose to view the data size for the top 5 clients, the aggregate data size for all clients, or view data for particular clients by selecting them from the Agent column in the table.
To compare the size between two time periods, specify a time period:
-
Next to Chargeback difference between, select a month, week, or date from each list, and then click Generate Report.
The Monthly, Weekly, or Daily Chargeback Difference by Clients Report appears.

This table explains the data included in each view in the chart.
|
View |
Description |
|---|---|
|
Front End Backup Size |
The amount of data in the largest full backup job from each subclient during the specified time period. If no full backup job completed during the specified time period, then it is the amount of data in the largest full backup job from the previous time period. This report calculates the amount of data only in the primary copy. For VMs, this is the largest guest size in the most recent full backup. For clients that have both VSA and other agents installed, only the front end size for VSA subclients is displayed. Jobs that run on a VM are counted only one time, regardless of the number of subclients that were used to back up the virtual machine. Deconfigured clients are not included in the Front End Terabytes (FET), and a value of 0 appears in the report. If an agent has multiple backup sets, the backup set with the largest backup size counts towards FET. |
|
Front End Archive Size |
The amount of data in all archive jobs from each subclient. This report calculates the amount of data only in the primary copy. Jobs that run on a VM are counted only one time, regardless of the number of subclients that were used to back up the virtual machine. If an agent has multiple backup sets, the backup set with the largest backup size counts towards FET. The following types of data are included:
Virtual server agents: The guest VM size is measured to calculate capacity. For more information, see Virtual Machines in the Capacity Calculation. |
|
Primary App Size |
The amount of application data, before compression and deduplication, that was written to primary copies, including aged data and pruned data, during the specified time period. For VMs, the application size is the backup size. For more information, see Size Measures for Virtual Machines. |
|
Total Media Size |
The amount of all active data that is saved on storage media, including all storage policy copies on all media types, and excluding aged data. For storage policy copies that have deduplication enabled, the media size for each job is calculated based on the average deduplication ratio of the copy. Where media size = application size * average deduplication ratio per copy. The average deduplication ratio of a destination copy is calculated by (total size on disk)/(total protected app size) for the destination copy. |
|
Top 5 |
Displays the top 5 largest storage policies in the CommCell environment. |
|
Aggregate |
Displays the aggregate calculation for the entire CommCell environment. |
|
Selected Entities |
Click Selected Entities, and then in the table, select the storage policies that you want to view. |
Details Table
This table displays the name of each storage policy in the CommCell environment and the front end backup size, front end archive size, primary app size, and total media size, depending on your selection in the chart.
|
Column |
Description |
|---|---|
|
CommCell Name |
Name of the CommCell where the storage policy is configured. |
|
Entity Name |
Name of the agent. You can click the agent name to view Chargeback Trends Report for only this agent type. |
|
Latest Size |
Size based on the most recently collected data. You can view data in daily, weekly, or monthly increments. For example, if you are viewing data in weekly increments, this value is the data size for the current week. |
|
Latest Size Change |
Difference between the most current size, and the size before that. For example, if you are viewing data sizes in weekly increments, this value is the difference between data size from the current week and the data size from last week. |
|
Latest Size Change (%) |
Percentage of difference in size between the most current size, and the size before that, For example, if you are viewing data sizes in weekly increments, this value is the percentage of difference between data size from the current week and the data size from last week. |
|
Day/Week/Month |
Displays the size of data for each day, week, or month, based on the selection you make in the chart. |