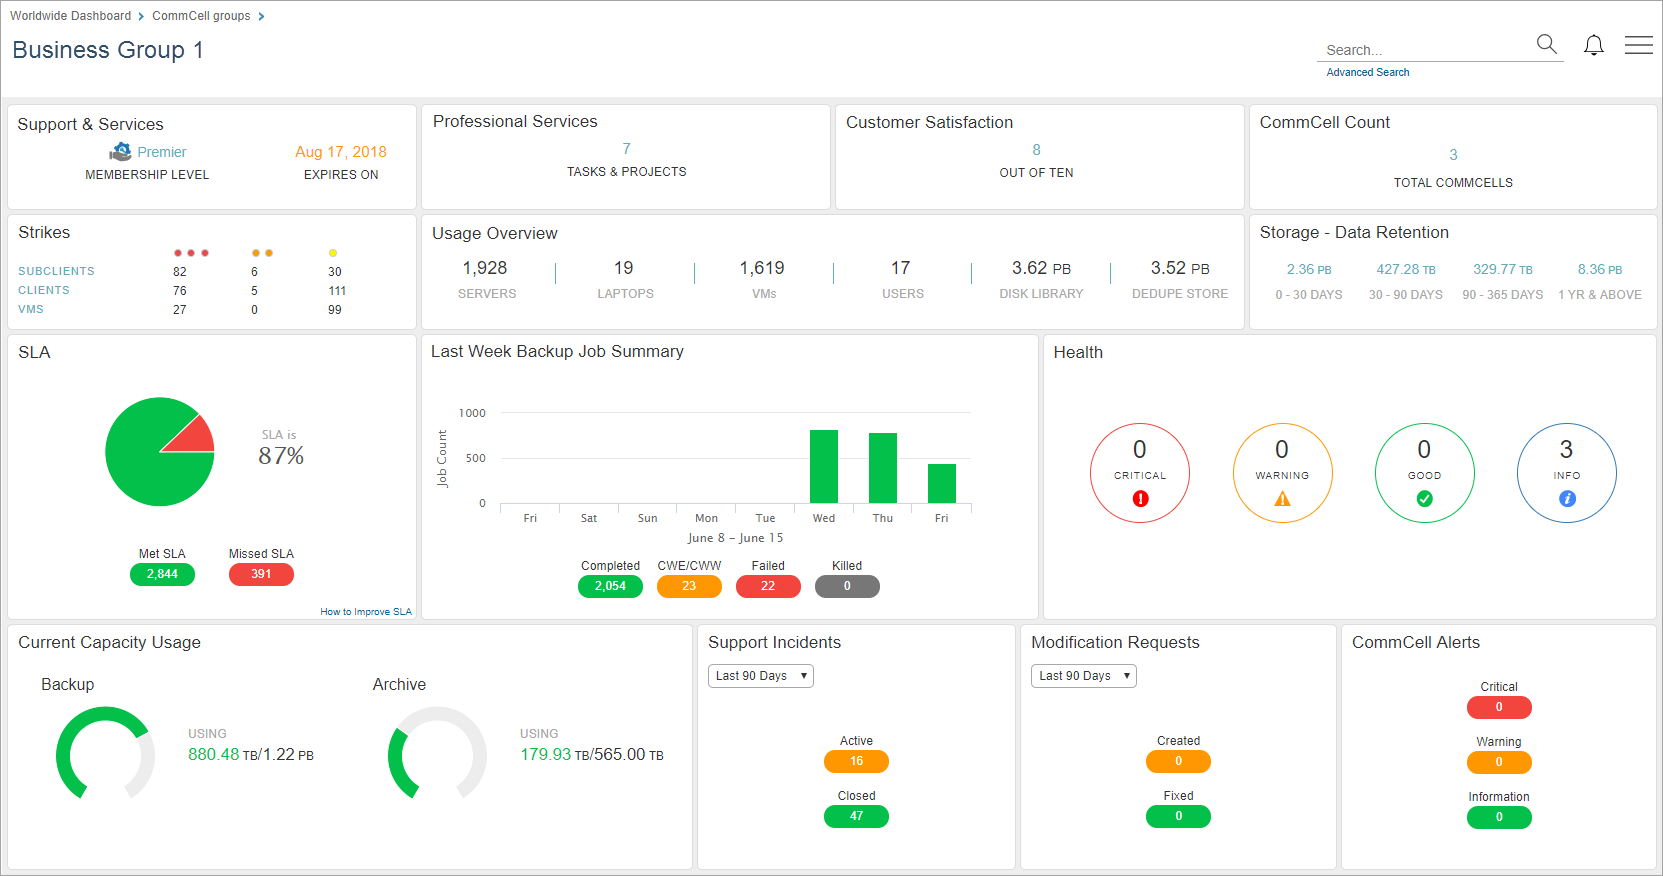
The CommCell group dashboard displays a preview of the most critical information gathered from all of the CommCell computers in your organization. Use the CommCell group dashboard to monitor CommCell performance from a high level. Many windows on the Dashboard open more detailed reports that you can use to analyze the collected statistics.
A CommCell group is created when you register Commvault software and user accounts are automatically associated with the corresponding CommCell group when they are created.

The following table includes descriptions for all of the tiles that are visible on the CommCell group dashboard.
|
Tile |
Description |
|---|---|
|
Support and Services |
Indicates your organization's membership level and service expiration date. |
|
Professional Services |
Displays the number of Professional Services tasks and projects currently under way for your organization. To view the Profile Tasks and Projects Report, click Professional Services. |
|
Customer Satisfaction |
Displays the customer satisfaction rating based on feedback employees enter in the Profile Dashboard. To view the Profile Dashboard, click Customer Satisfaction. |
|
CommCell Count |
Displays the number of CommServe computers in your environment. To view the CommCells page, click CommCell Count. |
|
Strikes |
Indicates the number of subclients, clients, and VMs that have one or more failed backup jobs since the last successful backup job. To view the Strike Count Report, click Strikes. |
|
License Usage Overview |
The number of servers, laptops, VMs, and users, the amount of space being used in disk libraries, and the size of deduplicated data. |
|
Storage - Data Retention |
The amount of stored data that will be retained for the next 0–30 days, 30–90 days, 90–365 days, and one year and above. To view the Data Retention Report, click Storage - Data Retention. Storage - Data Retention estimates the amount of data that will be eligible for pruning, based solely on the retention days and extended retention settings that are configured in the storage policy copy. Other parameters related to data retention, such as retention cycles and dependencies amongst backup types are not considered in this calculation. |
|
SLA |
Displays the percentage of all client computers that met or missed Service Level Agreement (SLA) at the last time data was collected. The formula used to calculate SLA is: Number of Clients that Met SLA / Total Number of Clients, at the time of data collection, regardless of the SLA time period configured for that particular client. To view the SLA Details Report, click SLA. |
|
Last Week Backup Job Summary |
Displays the number of jobs that completed, completed with errors, failed, or were killed during each day in the last week. To view the Activity Report, click Last Week Backup Job Summary. |
|
Health |
Displays the number of tiles that are in Good, Warning, or Critical state for each category of the Health Report. To view more detailed information about each category in the Health Report, click Health. |
|
Current Capacity Usage |
Indicates the amount of data in all of the largest full backup jobs and all archive jobs on all subclients. Also indicates whether you are approaching the capacity license limit. To view the License Usage Report, click Current Capacity Usage. |
|
Support Incidents |
Displays the number of active and closed support incidents during the specified time period. To view the Support Incidents Report, click Support Incidents. |
|
Modification Requests |
Displays the number of requests submitted for a change in the software during the specified time period. To view the Customer Modification Request Report V2, click Modification Requests. |
|
CommCell Alerts |
Displays the number of alerts in Information, Warning, and Critical status from CommCell environments over the previous seven days. To view the CommCell Alerts Report, click CommCell Alerts. |