You monitor logs by using the Log Monitoring application available in the Web Console. The Log Monitoring application appears in the Monitoring category on the My Applications page of the Web Console after your administrator sets up the application. You can use the Log Monitoring application to perform the following operations:
-
Search and Analyze Log Files
You can search and analyze log files that have been content indexed by monitoring policies. Searches are automatically saved and can be reused when required.
-
Save Searches
You can choose to save your search results as tables or graphs and then add the results to a dashboard.
-
Upload New Log Files for Immediate Indexing
You can upload log files that were not previously indexed and have the content indexed immediately to perform search operations.
-
Visualize Data
You can quickly view the system-generated log data from clients in your CommCell environment using the predefined Operation Dashboard. The Operation Dashboard displays widgets that contain charts and depict data from the search options set in the System Created Policy configured for the dashboard.
The Log Monitoring application has a set of pages where you can perform your monitoring tasks. The Home page, default dashboard, and search pages contain the log information.
Home Tab
The Home page is the landing page of the Log Monitoring application. It contains a high-level view of the log activity in your CommCell environment:
-
The total number of indexed log events
-
The earliest and the latest log events
-
Tables that display clients, log files, templates, monitoring policies, tags, and shared searches. The tables display the following columns:
-
Source Type: Lists each client, log file, template, monitoring policy, and tag.
-
Count: The number of log lines indexed for that particular client, log file, template, monitoring policy, or tag.
-
You can change the time period displayed on the Home page. Select from predefined time periods or create a custom time period.
Solutions Tab
The reports created using Log Monitoring Policy data sets appear under this tab.
For instructions about creating a report for a search, see Managing Searches in the Log Monitoring Application.
Default Dashboards
The Default dashboard, Hyper-V dashboard, and the F5 dashboard come with the Log Monitoring application. You can modify these dashboards, or you can create your own dashboards. For information about creating dashboards, see Creating Dashboards for Log Monitoring.
Search
The Search page consists of three panes: the chart, the event log table, and the facets list. The three panes become available after a search operation. To perform a search, see Searching Log Data on the Log Monitoring Dashboard.
|
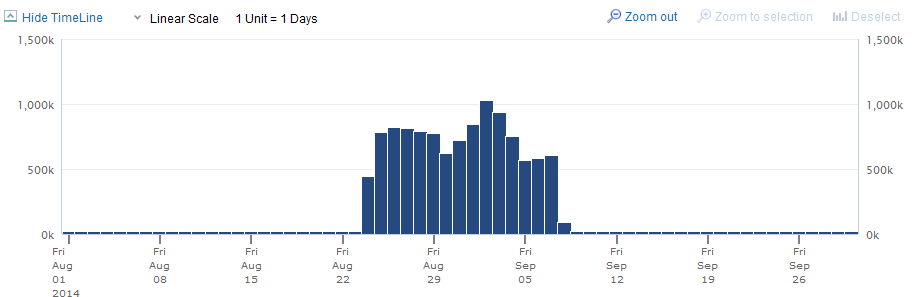
Chart |
Depending on your filter, scope, and time range selections, the chart displays data related to the indexed log files.
|
|
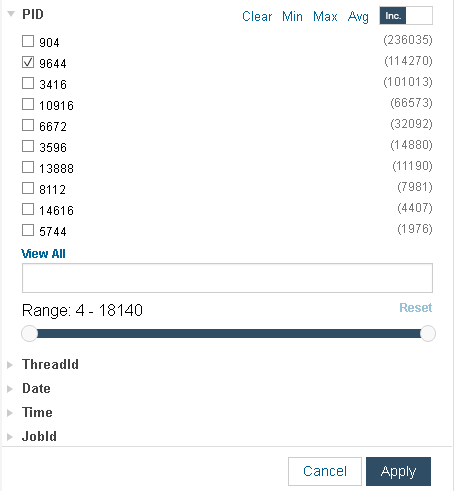
Facet List |
The facet list includes categories you can expand to further filter the data that appears in the chart and event log table, for example, expand the Client category to see a list of clients you can filter by. For facet categories that are integers, the following options are available:
|
|
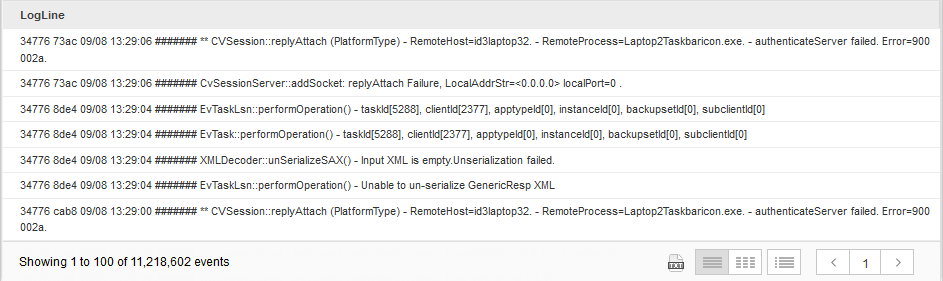
Event Log Table |
The event log table lists each indexed log line that meets the criteria configured for the selected client, log file, template, and monitoring policy. Hover over a row in the event log table and click on the down arrow that appears to select additional filtering options. For example, select 25 Lines to see the 25 lines above and below the row you selected. For MiFID logs, the Download option appears in the filtering options. Select this option to download the original MiFID log file.
|