Depending on your subscription, you can view subscription usage in the Active Directory – Standard Usage Report and/or Active Directory – Enterprise Usage Report.
Viewing the Usage Report
-
From the Command Center navigation pane, go to Manage > Account > Subscription and Usage > Usage.
The Usage Summary page lists all Active Directory subscriptions purchased for your organization in the subscriptions table.
-
Click Active Directory – Standard or Active Directory - Enterprise.
-
To view information for a specific time frame, click Time frame, and then select one of the time options.
Active Directory Usage Report
The forest recovery for Active Directory Usage Report provides information about the number of unique Active Directory and/or Azure Active Directory enabled user accounts from your organization protected during the specified time period.
Current and Peak usage
Current usage represents the number of Active Directory and/or Azure Active Directory enabled user accounts protected by the product. This value updates dynamically when new AD or Azure AD enabled user accounts fall under protection. You can monitor current usage in the Month to Date Usage chart within the Usage reports.
Peak usage represents the highest number of AD and/or Azure AD enabled protected during a given month. This value reflects the maximum level of protected enabled accounts and does not decrease even if the number of enabled accounts drops to a lower level during the month.
For example, if an enabled user account was protected for any number of days within the month, it is included in that month’s peak usage count. If the enabled user account is later decommissioned, it still counts toward the peak for that month. However, if it is not protected in subsequent months, it is not counted in those later usage periods.
Month to Date Usage chart
Current: The Current view of the Month to Date Usage chart displays the exact number of unique Active Directory and/or Azure Active Directory enabled user accounts protected as of the previous day. For example, if you view the chart on March 20, you can view data up to March 19.
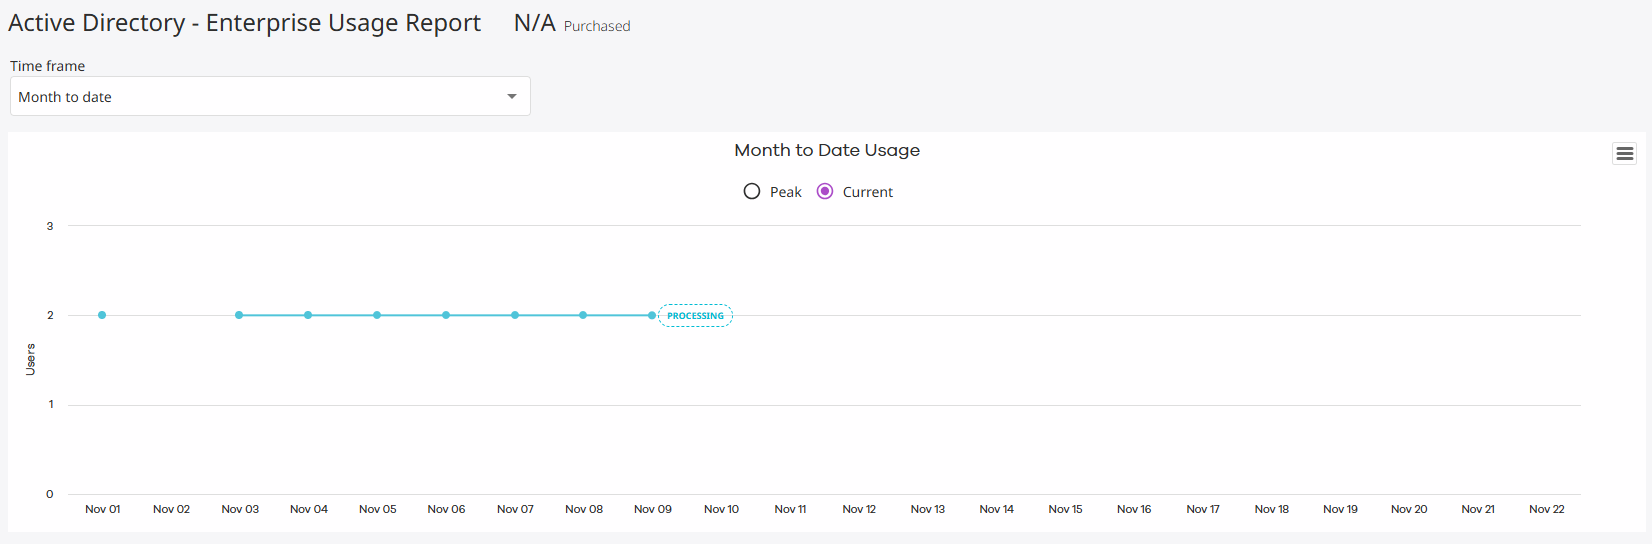
Peak: The Peak view of the Month to Date Usage chart displays the largest number of unique Active Directory and/or Azure Active Directory enabled user accounts protected up to the previous day.

Similarly, you can view current and peak usage for the previous 3, 6, or 9 months.
User Count tiles
The totals displayed in the User Count tiles update dynamically based on the time frame you select at the top of the report.
-
Total users: The total number of unique Active Directory and/or Azure Active Directory enabled user accounts protected during the selected time period, up to the previous day.
-
Total Active Directory users: The total number of unique enabled user accounts with Active Directory protection enabled during the selected time period, up to the previous day.
Monthly Usage
-
The Monthly Usage table lists each unique Active Directory and/or Azure Active Directory enabled user account protected during the current month.
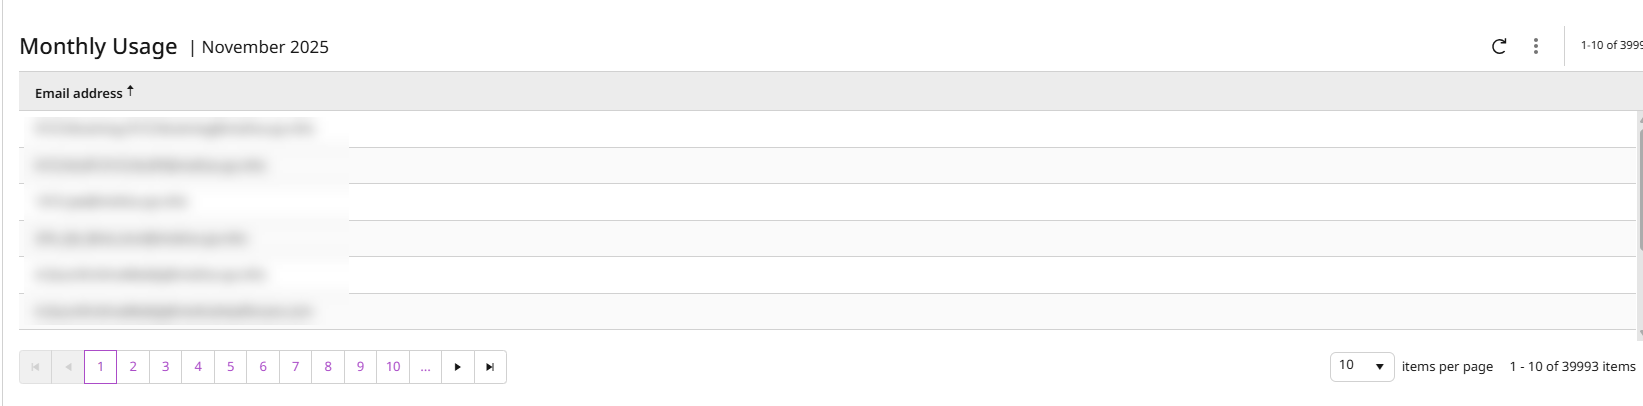
You can optionally configure or export the Monthly Usage data using the following options:
-
To hide columns, click the Column button
 , clear the columns that you want to hide, and then click Save.
 -
To export data, click the Export button
 , select the export file format, and then save the file to your local computer.
 -
To reload the chart so that it includes the most recent data, click Reload data
 .
.
Reducing Active Directory usage
To reduce your Active Directory subscription usage, do the following:
-
Disable user accounts in Active Directory or Azure Active Directory that no longer need to be protected.
-
Remove Active Directory domains or Azure Active Directory tenants that do not require recovery protection.
-
Consolidate recovery plans to eliminate overlapping protection configurations across multiple domains.