The Commvault Enterprise Explorer is a tool that collects information about the Microsoft Windows resources in your environment. This information is sent to the Analytics platform, where end-users can view several interactive dashboards.
Before You Begin
You must collect information about the computers in a domain by running Enterprise Explorer. For more information, see Collecting Data for the Enterprise Explorer Dashboards.
Procedure
-
In a Web browser, go to the server endpoint that you used when collecting data for Enterprise Explorer.
For example, if you used the server endpoint cloud.commvault.com, go to http://cloud.commvault.com/webconsole.
-
Log in with the credentials of the server endpoint user that you used when collecting data for Enterprise Explorer.
-
Click Analytics > Open Data Source.
-
In the tile for the data source that was created by Enterprise Explorer, click Search.
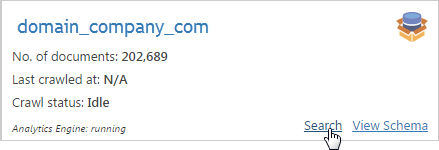
Note: Enterprise Explorer data sources are named according to the Active Directory name. For example, domain_company_com.
-
Under the Reports section, click the name of the dashboard that you want to view.
-
Security_Report: Contains information about recommended updates that are missing on computers in the domain.
-
CriticalEvents_Report: Contains information about system events that occurred on computers in the domain.
-
Commvault_Report: Contains information about the Commvault related software installed on computers in the domain.
-
Virtualization_Report: Contains information about any virtual servers and virtual machines that are running on the crawled domain.
-
Software_Report: Contains information about the software that is installed on computers in the domain.
-
System_Report: Contains information about the system, such as operating system and hardware information, for the computers in the domain.
-