You can view read and write metrics, on a per storage proxy level, in the Hedvig WebUI.
Procedure
-
Login to the Hedvig WebUI with the appropriate credentials (Hedvig or LDAP user).
-
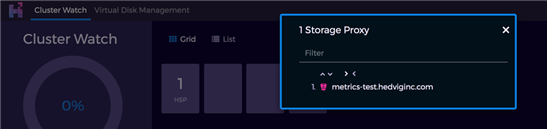
Click on the Cluster Watch tab to see the cluster layout.
-
Click on the HSP box.
A list of available Storage Proxies is displayed. Hedvig S3 Storage Proxies are identified with a bucket icon (
 ).
).
-
Click on the desired storage proxy to open the Metrics page.
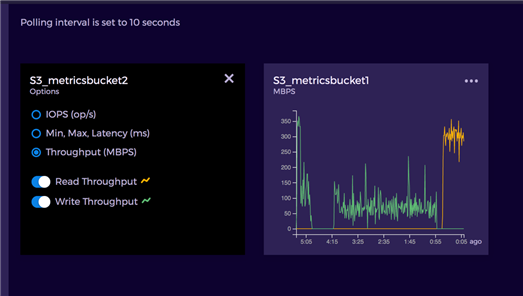
The Metrics page lets you view read/write IOPS, min/max latencies, and throughput for every bucket that has been accessed through that storage proxy.
The left side of the Metrics page shows available metrics options. It is also displayed by clicking the ellipsis (...) at the top right corner of an individual bucket graph. You can toggle these options to see the desired metrics on the graph.
To interpret the metrics displayed in the preceding figure:
-
One IO corresponds to one PUT or GET object.
-
All calculations are based on the size and latency of PUT or GET IOs that occurred during that sampling interval.
-
The latency is calculated as the time taken for one PUT or GET IO to complete.
-