You can add your own JavaScript expressions to any report. Use these expressions to add data or modify the appearance of the report.
Before You Begin
-
To create data sets, build reports, manage reports, and deploy reports to the dashboard, your CommCell user account requires a role with the following permissions: Add Report, Delete Report, Edit Report, Execute Report, Add Datasource, Delete Datasource, Edit Datasource, Query Datasource.
-
Your CommCell user account must have an association with the CommCell entity.
For more information on users, permissions, and associations, see User Administration and Security - Overview.
About This Task
You can use built-in variables to help you write expressions more easily. Use the cellData variable to refer to the data in the column that you selected, where you write the expression. To use data from other columns in your expression, you can use the row variable, which controls data for the entire row, and the column ID together to create row['columnID'].
Procedure
-
Open a report, and then click File > Edit.
The Report Builder page appears.
-
To add customizations to the report, select a report component, such as a table column.
-
On the Properties tab, click Custom Code
 , and then enter your customizations:
 -
To add custom code to the entire report, select the Report Name tab, and then in the Custom Java Script box, type JavaScript statements and expressions.
-
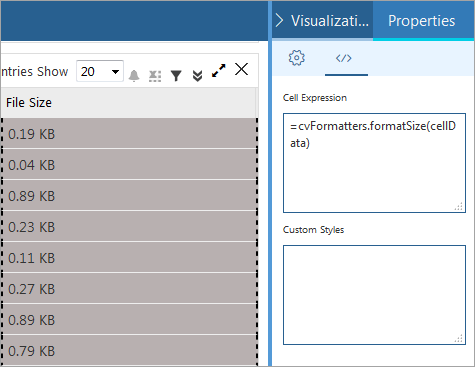
To add custom code to a table column, select the table, select the column, and in the Cell Expression box, type JavaScript statements and expressions.
-
-
To customize the appearance of the report, in the Custom Styles box, type CSS declarations.
-
Click Save.
-
Click Deploy.
The report displays your customizations.
Examples
Use the following examples to customize reports.
Adding Styles to a Row
Use CSS formatting to color all the rows blue in a data table.
-
On the Properties tab, click Custom Code
. -
Beside Row Style, click Add Style.
The Custom Code dialog box appears.
-
Enter the following code:
background-color:#0000FFNote
For expressions in a row, you can access only the row object. The cellData value is not available in the expression. To access a cellValue in your expression, use row[‘column id’].
-
Click Save.
-
Click Deploy.
Adding Styles to a Column
Use CSS formatting to color the data in a column.
-
To make data greater than 19,000 and less than 20,000 appear red, select a column, and in the Custom Styles box, type:
:=if(row['id'] > 19000 && row['id'] < 20000){ return "background-color:#F08080" } -
To make all cells that contain the text, "art" appear blue with a white and green border, select a column, and in the Custom Styles box, type:
:=if(cellData === "art"){ return "background-color:cyan;color:white;border:1px solid green" } -
Click Save.
-
Click Deploy.
Coloring Data in Columns
Use the cellData variable to display data in different colors.
-
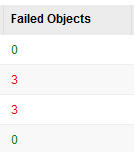
To make failed objects that are greater than two appear in red, and failed objects that are less than two appear in green, select the Failed Objects column and in the Custom Styles box, type:
:=if(cellData > 2){ return '<span style="color:red">'+cellData+'</span>' }else{ return '<span style="color:green">'+cellData+'</span>' } -
Click Save.
-
Click Deploy.
Any number greater than two appears in red in the Failed Objects column, and any number less than two appears in green:
Creating Data from Values in Other Columns
Create data by using the values from specific columns in a formula that calculates the storage space saved.
-
Create a data set that includes the AppData and DiskSize fields.
-
Select the Space Saved column and in the Custom Styles box, type:
= ((row['AppData'] - row['DiskSize'])*100)/(row['AppData']) -
Click Save.
-
Click Deploy.
The Space Saved column displays the results of the formula.