Verify the setup from the production CommServe host to ensure that the default components are installed and configured properly.
CommCell Console
Open the CommCell Console and verify the following. For more information on opening the CommCell Console, see Opening the Stand-Alone CommCell Console.
-
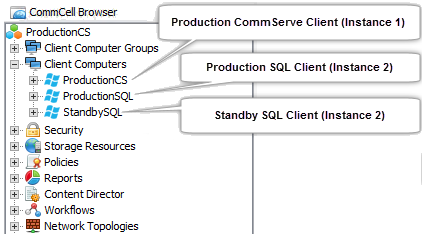
Clients: From the CommCell Browser, navigate to Client Computers.
The following clients should be displayed.
-
CommServe Client on the Production host
-
SQL Client on the Production host
-
SQL Client on the Standby host
Click here to view an example

-
-
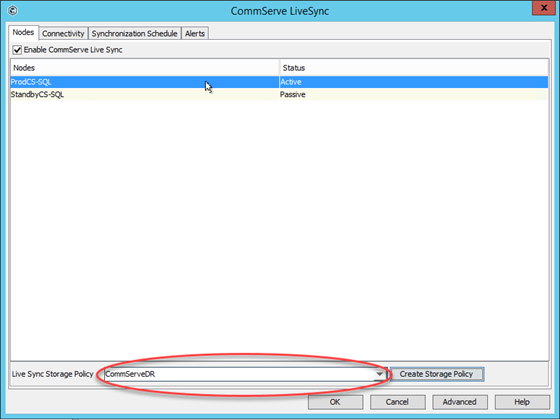
Storage Policy: From the Control Panel, click CommServe LiveSync in the CommCell group.
The CommServeDR storage policy will be selected in the Live Sync Storage Policy box.
Important
To ensure successful completion of the LiveSync operation, make sure that a library is configured in the CommCell. This CommServeDR storage policy is automatically created when the first library is configured in the CommCell. This storage policy is used by default by the LiveSync operation.
Click here to view an example

If necessary, a user-defined storage policy can also be used to perform the LiveSync operation. For more information on changing the storage policy, see Modifying the Storage Policy for SQL LiveSync Operations.
-
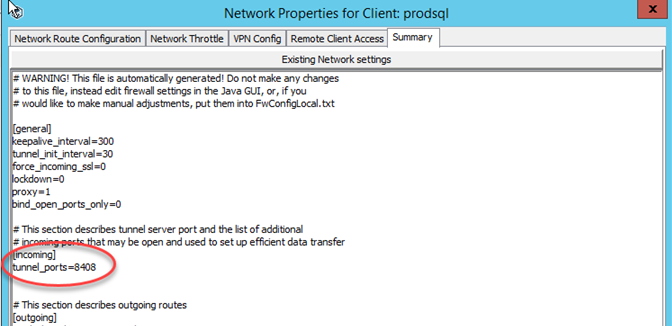
Tunnel Port on the SQL client: From the CommCell Browser, right-click the SQL client on the active CommServe host > Properties > Network > Summary.
The tunnel ports are displayed under [incoming].
Click here to view an example.

Important
By default, network route are added to all the clients using the SQL clients in the CommServe hosts as the proxy. Make sure that all clients can communicate with the SQL client in the active CommServe, on the tunnel port. The default tunnel port for the SQL client is 8408.
If necessary, you can setup an alternate route for client communication. For more information on setting up client communication, see Setting Up Client Communication With the CommServe.
-
Live Sync Subclient: From the CommCell Browser, navigate to Client Computers > <SQL Client on the Production host> > SQL Server > <Instance>.
The CVFailoverLogShipping subclient will be displayed in the right pane.
Click here to view an example

-
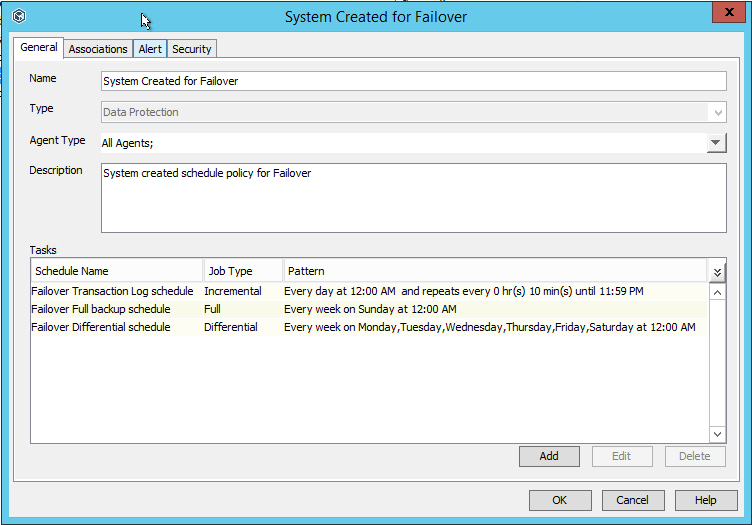
Schedule Policy: From the CommCell Browser, expand Policies > Schedule Policies.
The System Created for Failover schedule policy will be displayed in the right pane.
The following schedules will be created in this Schedule Policy:
-
Failover Transaction Log schedule
-
Failover Full backup schedule
-
Failover Differential backup
Click here to view an example

-
-
LiveSync schedule: From the CommCell Browser, right-click the <CommServe> > View > Schedules.
The LiveSync Schedule will be displayed in the right pane.
Click here to view an example

-
Multiple CommServe Hostnames: The Clients For Commserv LiveSync Client Group is created, and all clients with Version11 SP14 (and above) are included in this Client Group. If the Clients For Commserv LiveSync Client Group is not created automatically, follow the steps described in Missing Clients For Commserv LiveSync Client Group.
The sCSINTERFACELIST additional setting is setup, for this client group, with the names of the active and passive CommServe hosts, so that the clients can automatically connect to an available CommServe host.
Process Manager
Important
Verify that the Status icons in the Process Manager for Production Node and Passive Node(s) are displayed in green in both the Production and Standby CommServe hosts, before enabling the CommServe LiveSync operation.
Once the CommServe LiveSync feature is enabled, verify the following in the Process Manager.
-
Open the Process Manager and verify that communication and services are running. For more information on opening the Process Manager, see Using Process Manager to View and Manage Commvault Services.
-
Verify the Node Information as follows:
Open the Process Manager associated with the SQL Server client.
The Failover Assistant tab will display the following information:
-
The name of the SQL instance in the Production Node
-
The name of the SQL instance in the Passive Node(s)
-
Last monitored time
-
Status icon on the Production CommServe Host:
-
If Production Node icon is red – some or all services are not running in the CommServe instance (usually Instance 1). Alerts (if configured) are sent to notify users that service(s) are not running in the production CommServe host.
-
If Passive Node(s) icon is red – some or all services are not running in the SQL instance (usually Instance 2) in the standby CommServe, or there is a communication issue between the SQL instances. Alerts (if configured) are sent to notify users that SQL client service(s) are not running.
-
-
Status icon on the Standby CommServe Host:
-
If Production Node icon is red – some or all services are not running in the SQL instance (usually Instance 2) in the production Commserve, or there is a communication issue between the SQL instances. Alerts (if configured) are sent to notify users that SQL client service(s) are not running.
-
The Passive Node(s) will never be red.
-
Click here to view an example

-
-
Verify that the Services are started from all the Process Managers in the active and standby CommServe hosts as follows:
From the Process Manager, click the Services tab.
All the services should be running in the Process Manager associated with the following:
-
Production CommServe host - CommServe client
-
Production CommServe host - SQL Server client
-
Standby CommServe host - SQL Server client
All the services should be stopped in the Process Manager associated with the following:
- Standby CommServe host- CommServe client
-
What to Do Next
Verify Disaster Readiness (Optional)
Perform a test failover to ensure successful production failovers. Test failovers do not affect the current jobs and activities on the production CommServe host. For more information on performing a test failover, see Verifying Disaster Readiness.
Related Topic
Network Topologies and Clients Groups Created for CommServe LiveSync