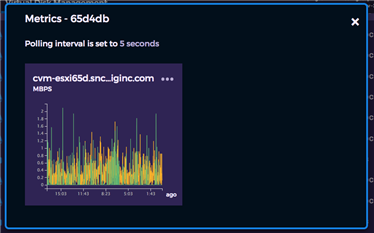
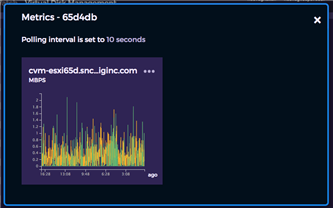
You can view performance metrics (IOPS; Min, Max, Latency; or Throughput) for a specified virtual disk.
Note
In the Hedvig WebUI, all IOPS metrics are based on a 4k block size. If your application or test tool metrics are based on a different block size, the IOPS displayed in the application or test tool will be different from those displayed in the Hedvig Web UI.
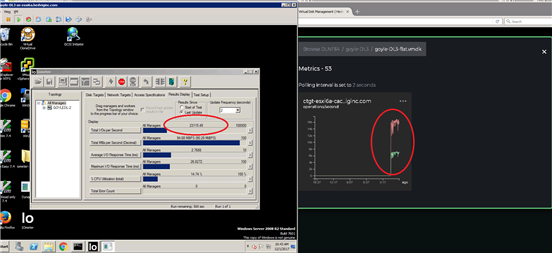
In the following example, the Iometer workload on the left is comprised of a mixed random 4k workload using 70% reads and 30% writes. These values are reflected in the Hedvig virtual disk metrics in red and green, respectively.
Procedure
-
On the Virtual Disk Management (VDM) page, click the ellipsis (...) to the left of the desired virtual disk, and select Metrics.
-
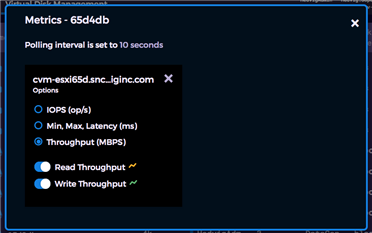
In the Metrics dialog, you can change metrics to IOPS; Min, Max, Latency; or Throughput, by clicking the ellipsis (...) to the right of the storage proxy name.
-
You can also change the polling interval by clicking the 10 seconds amount in the line, Polling interval is set to 10 seconds.