Verify the setup from the production CommServe host to ensure that the default components are installed and configured properly.
Command Center
-
Login to the Command Center. For more information on logging in to the Command Center, see Accessing the Command Center.
-
From the navigation pane, go to Manage > System.
The System page appears.
-
Click the CommServe LiveSync tile.
The CommServe LiveSync page appears.
-
Verify the following:
-
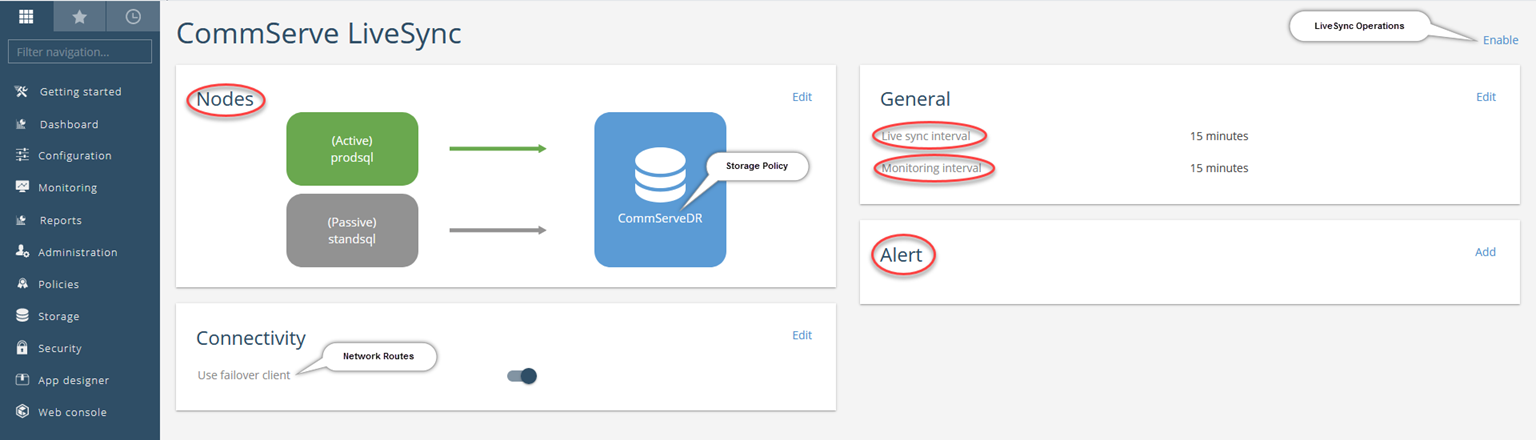
Node Information: The currently active and passive nodes are displayed under Nodes.
-
Storage Policy: By default, the CommServeDR storage policy will be selected as the target storage policy for the active and passive nodes, under Nodes.
Important
To ensure successful completion of the LiveSync operation, make sure that a library is configured in the CommCell. This CommServeDR storage policy is automatically created when the first library is configured in the CommCell. This storage policy is used by default by the LiveSync operation.
If necessary, a user-defined storage policy can be setup to perform the LiveSync operation. For more information on changing the storage policy, see Editing the Storage Policy for SQL LiveSync Operations.
-
Network Routes: By default, the failover client (or the SQL clients) on the CommServe hosts are used as the proxy to connect to the CommServe.
If necessary, you can setup an alternate route for client communication. For more information on setting up client communication, see Editing Client Communication With the CommServe.
Important
By default, network route are added to all the clients using the SQL clients in the CommServe hosts as the proxy. Make sure that all clients can communicate with the SQL client in the active CommServe, on the tunnel port.
-
Live Sync Operations: By default, Live Sync operations are disabled.
Enable the CommServe LiveSync feature which facilitates CommServe Recovery Using High Availability CommServe Host. For more information on enabling the LiveSync operation, see Enabling and Disabling CommServe LiveSync.
-
Live Sync Interval: By default, the synchronization frequency for LiveSync operations is set to 20 minutes. For more information on modifying the synchronization frequency, see Editing the Synchronization Frequency.
-
Monitoring Interval: By default, the proxy client(s) monitor connectivity to the currently active CommServe server every 5 minutes. For more information on modifying the monitoring frequency, see Editing the Monitoring Interval.
-
Alerts: By default, the CommServe LiveSync alert is not setup. For more information on setting up this alert, see Setting Up Alerts.
-
Default Subclient on the standby SQL Client: Verify that backups on the default subclient in the SQL Client associated with the standby CommServe host, is disabled.
-
Click here to view an example.
Process Manager
Important
Verify that the Status icons in the Process Manager for Production Node and Passive Node(s) are displayed in green in both the Production and Standby CommServe hosts, before enabling the CommServe LiveSync operation.
After enabling the CommServe LiveSync feature, verify the following in the Process Manager.
-
Locate the Commvault Process Manager from the Desktop in the active CommServe host. There will be 2 instances of the Process Manager associated with the following software installed in the CommServe host:
-
CommServe Client
-
SQL Client (The Failover tab is located in this instance.)
-
-
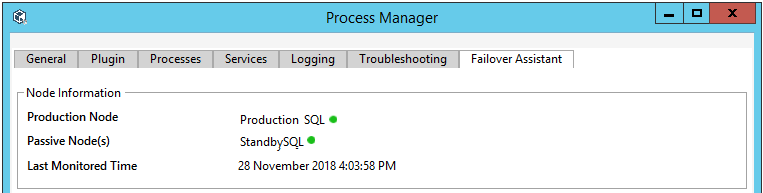
Verify the Node Information as follows:
Open the Process Manager associated with the SQL Server client.
The Failover Assistant tab will display the following information:
-
The name of the SQL instance in the Production Node
-
The name of the SQL instance in the Passive Node(s)
-
Last monitored time
-
Status icon on the Production CommServe Host:
-
If Production Node icon is red – some or all services are not running in the CommServe instance (usually Instance 1). Alerts (if configured) are sent to notify users that service(s) are not running in the production CommServe host.
-
If Passive Node(s) icon is red – some or all services are not running in the SQL instance (usually Instance 2) in the standby CommServe, or there is a communication issue between the SQL instances. Alerts (if configured) are sent to notify users that SQL client service(s) are not running.
-
-
Status icon on the Standby CommServe Host:
-
If Production Node icon is red – some or all services are not running in the SQL instance (usually Instance 2) in the production Commserve, or there is a communication issue between the SQL instances. Alerts (if configured) are sent to notify users that SQL client service(s) are not running.
-
The Passive Node(s) will never be red.
-
Click here to view an example
-
-
Verify that the Services are started from all the Process Managers in the active and standby CommServe hosts as follows:
From the Process Manager, click the Services tab.
All the services should be running in the Process Manager associated with the following:
-
Production CommServe host - CommServe client
-
Production CommServe host - SQL Server client
-
Standby CommServe host - SQL Server client
All the services should be stopped in the Process Manager associated with the following:
- Standby CommServe host- CommServe client
-
What to Do Next
Verify Disaster Readiness (Optional)
Perform a production failover to switch the CommServe server from the currently active CommServe host to a standby CommServe host. For more information on performing production failovers, see Performing Production Failovers.