You can create a link that opens a preview of data in either a dialog box or an HTML component. The links are useful if you want to analyze data, such as email messages or text files.
You can configure data from a data table, a data grid, or a tree grid component to display data from the data set or a REST API response. You can also format the data that appears in the component or the dialog box using CSS and HTML.
Before You Begin
Create a report that includes any of the following components:
-
Data Grid
-
Tree Grid
Procedure
-
Log on to the Web Console, and click Reports.
The Reports page appears.
-
From the navigation pane, go to Configuration > Reports, and in the row for the report, under Actions, click Edit.
-
To display the data preview in an HTML component, from the Visualization tab, drag Html to the Drop components to build the report box.
-
Select a Data Table component, a Data Grid component, or a Tree Grid component.
-
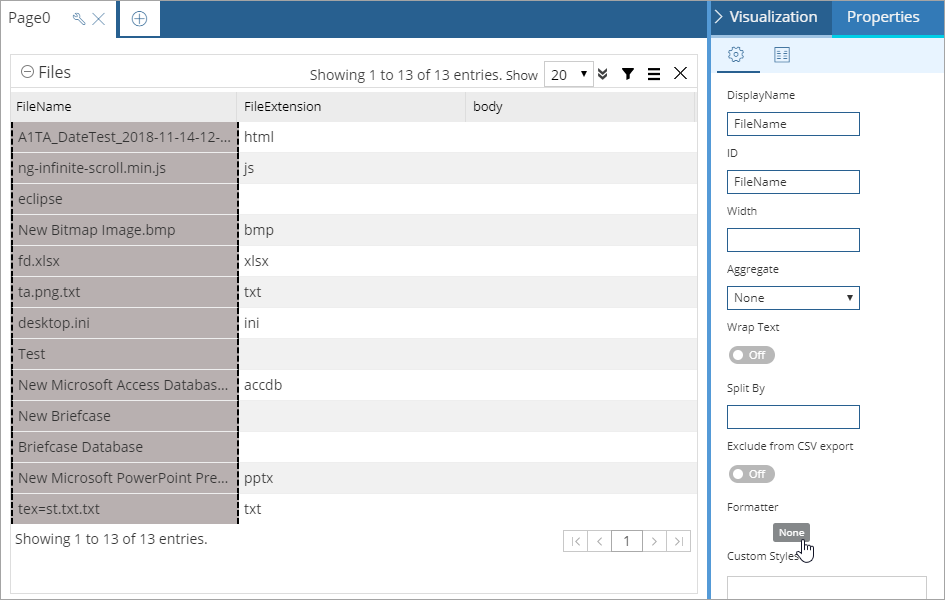
To configure a preview from a column in a Data Table, select a column, and then configure the column options:
-
Beside Formatter, click None.
The Formatter dialog box appears.
-
From the Type list, select Link.
-
-
To configure a preview from a row in a Data Table, select the table, and then enable the row options:
-
On the Properties tab, click General
 , and then move the Enable Row Selection toggle key to the right.
 -
Click Custom Code
 , and then expand Format row.
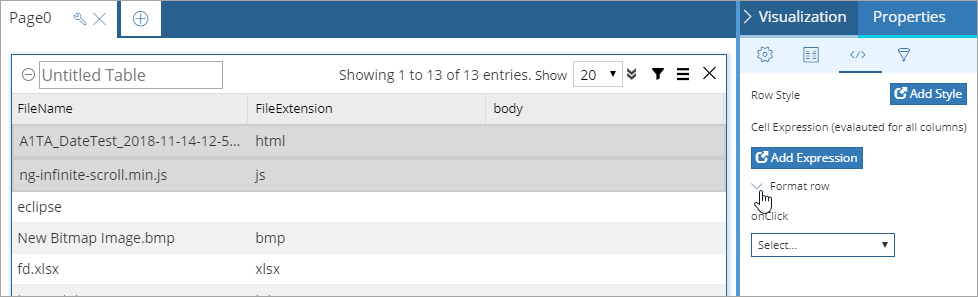
-
-
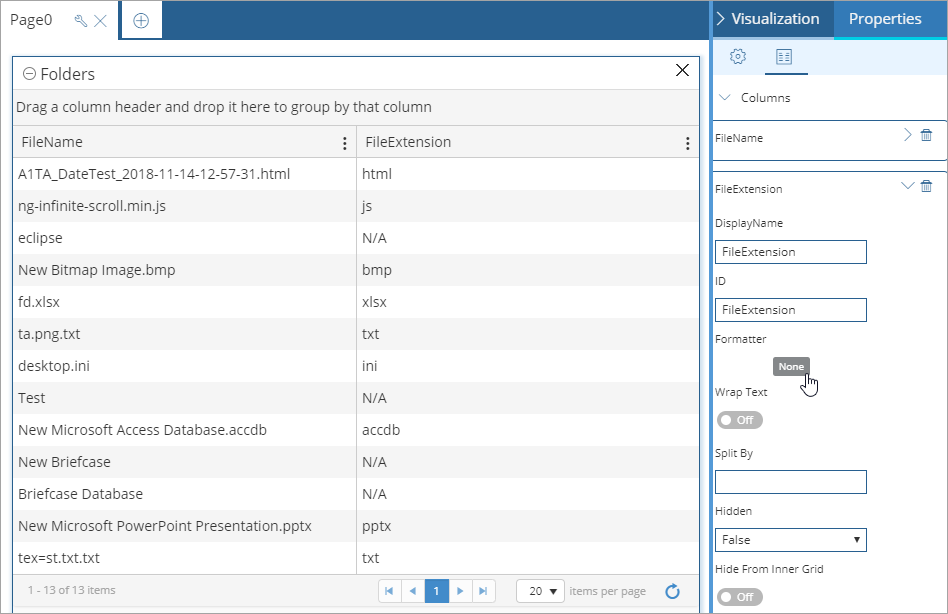
To configure a preview for a Data Grid or Tree Grid, go to the options for a column:
-
On the Properties tab, click Fields
 , and then expand Columns.
A list of all the columns appears.
-
Expand a column.
-
Beside Formatter, click None.
The Formatter dialog box appears.
-
From the Type list, select Link.
-
-
From the onClick list, select Show Preview.
-
To display the data preview in the HTML component that you created in a previous step, from the Component ID list, select the ID for the HTML component.
-
Configure the data that is displayed in the preview:
-
To display a preview of data from the data set, select Columns, and then from the Preview columns list, select the columns that you want to display in the preview.
-
To display a preview of data from a REST API, select REST API, from the list select the REST API method, and then in the box type the REST API URL and parameters. For example, type the following command:
http://myvm-web.domain.com/webconsole/service/datacube/core/createDataSource
-
-
To add a JSON body to the REST API, enter some JSON code:
-
Click Add JSON Body.
The Code Editor dialog box appears.
-
In the box, type some JSON code, and then click Save.
-
-
To configure some custom styles to the column or REST API, enter some HTML code:
-
Click Add Expression.
The Code Editor dialog box appears.
-
In the box, type some HTML code, and then click Save.
-
-
Click Apply.
-
In the upper-right corner of the report builder, click Save.