When you add a HTML component to a report, you must configure the appearance using HTML.
Before You Begin
-
To build and deploy reports, your CommCell user account requires a role with the Add Report permission and an association with the CommCell entity.
For more information on users, permissions, and associations, see User Administration and Security - Overview.
Procedure
-
Log on to the Web Consoleand click Reports.
The Reports page appears.
-
From the navigation pane, click Configuration > Reports, and in the row for the report, under Actions, click Edit.
-
Optional: If your report has multiple pages, click the tab for the page that you want to edit.
-
From the Visualizations tab, drag Html to the Drop components to build the report box.
-
From the Data Sets list, drag an alphabetic-type field name to the Drop Data Columns box.
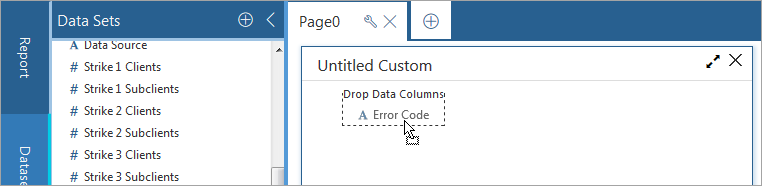
By default, nothing appears in the chart.
-
You can drop multiple field names into the Drop Data Columns box to plot additional information in the chart.
-
Select the component, on the Properties tab, click General
 , and configure any of the settings.
Configure the component settings under General:
-
To name the HTML component, in the Chart Title box, type a name for the component.
-
To configure a different ID for the HTML component, in the ID box, type a new identifier for the component.
-
To hide the header information, select Hide Header.
-
-
On the Properties tab, click Fields
 , and configure any of the settings under Field Name:
 -
To change the identifier for the field, in the ID box, type another field name.
-
To specify the type of numeric value to display for the field, in the Aggregate list, select one of the available options, such as Count or Avg.
-
To remove the field from the HTML component, click Remove Measure
 .
.
-
-
To configure the appearance of the HTML component, on the Properties tab, click Custom Code
 :
: -
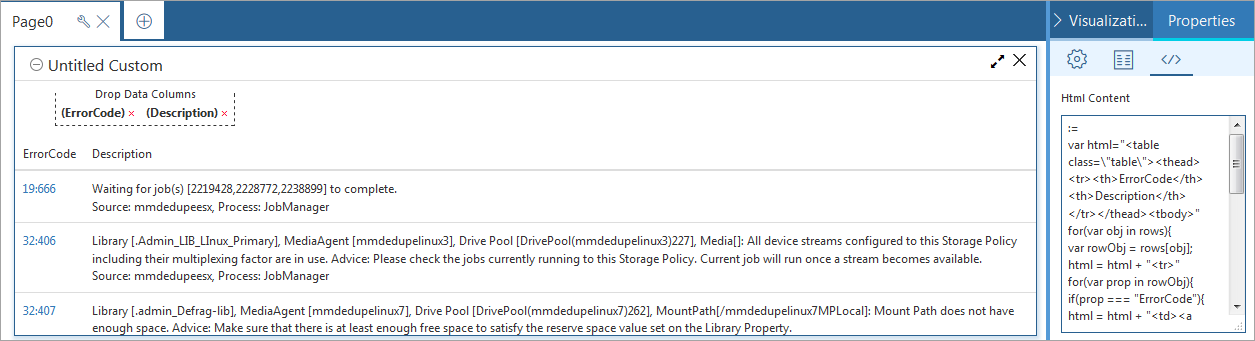
In the Html Content box, enter HTML code.
For example:
:=
 var html="<table class=\"table\"><thead><tr><th>Error Code</th><th>Description</th></tr></thead><tbody>"
 for(var obj in rows){
 var rowObj = rows[obj];
 html = html + "<tr>"
 for(var prop in rowObj){
 if(prop === "ErrorCode"){
 html = html + "<td><a target='_blank' href='http://kb.commvault.com/#!/?q=%22"+rowObj[prop]+"%22'>" + rowObj[prop]+"</a></td>"
 }else{
 html = html + "<td>" + rowObj[prop]+"</td>"
 }
 }
 html = html + "</tr>" ;
 }
 html = html + "</tbody></table>" ;
 return html;
This image is an example of the HTML component with HTML Content configured:
-
-
To save this version of your report specification in the Reports Manager, at the top of the Report Builder page, click Save.
-
To make the report available to end users on the Reports page, at the top of the page, click Deploy.