When you add a vertical or horizontal bar chart to a report, you can configure additional options.
Before You Begin
-
To build and deploy reports, your CommCell user account requires a role with the Add Report permission and an association with the CommCell entity.
For more information on users, permissions, and associations, see User Administration and Security - Overview.
Procedure
-
On the Web Console, click Reports.
The Worldwide Dashboard appears.
-
To open a report where you have already added a data set, from the navigation pane, click Configuration > Reports, next to the Report Name under Actions, click Edit.
-
Optional: If your report has multiple pages, click the tab for the page that you want to edit.
-
From the Visualization tab, drag Vertical Bar or Horizontal Bar to the Drop components to build the report box.
-
From the Data Sets list, drag an alphabetic-type field name to the Drop X-Axis box.
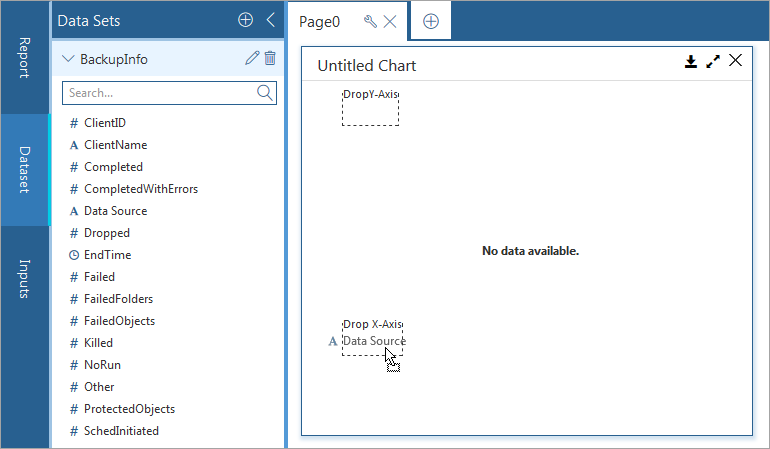
By default, the Y-Axis will display a count of the field that you selected for the X-Axis.
-
If you want to graph something other than the default, delete the Y-Axis selection, and from the Data Sets list, drag another field name to the Drop Y-Axis box.
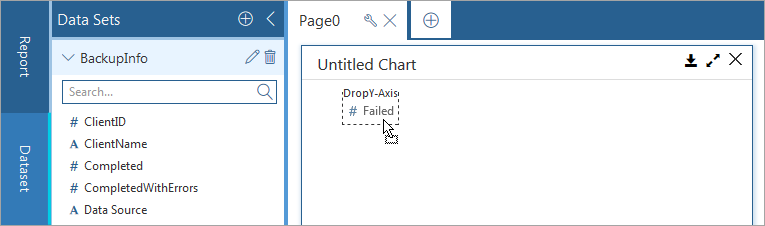
A list appears under Drop Y-Axis.
-
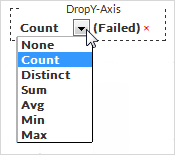
Select an option for the type of aggregate information that you want to display in the chart.
Options vary based on the type of field that you select.
-
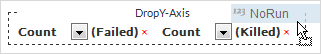
You can drop multiple field names into the Drop Y-Axis box to plot multiple bars in the chart.
-
Select the chart, on the Properties tab, click General
 , and then configure any of the chart options.
For information about options on this tab, see General Properties for Horizontal Bar Charts.
-
On the Properties tab, click Fields
 , and then configure any of the chart settings.
For information about options on this tab, see Field Properties for Horizontal Bar Charts.
-
To configure settings under Custom Code
 , see Configuring Custom Code and Custom Styles for Reports.
 -
To save this version of your report specification in the Reports Manager, at the top of the Report Builder page, click Save.
-
To make the report available to end users on the Reports page, at the top of the page, click Deploy.